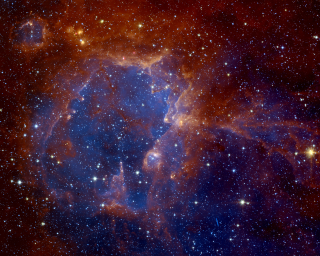
 Over the last few years, professional astronomers have collectively created four astounding resources without which Galaxy Map could never have been constructed. Three of these take the form of websites, mirrored in multiple locations to improve performance: the ADS library of scientific papers and abstracts, the SIMBAD directory cross referencing 5 million celestial objects, and the Vizier collection of 7 thousand astronomical catalogs.
The Virtual Observatory
The fourth and by the far the largest of these resources, the Virtual Observatory (VO), is still very much under development. The VO is not a single website but rather a consistent set of protocols for finding, analysing and manipulating the images that result from astronomical observations. There are now huge databanks containing many trillions of bytes of image data available online. These databanks provide the raw data used by NASA and ESA publicists to produce stunning images often reprinted by newspapers and astronomy magazines.
What is often not understood is that the images released by space agency publicists are a tiny and not very representative sample of what is available through the VO. Space agencies often emphasise visually striking images of fairly familiar objects (often collected by the Hubble space telescope) and these are not necessarily the most interesting or scientifically significant images available.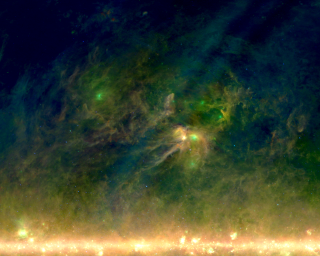
A maze of twisty little passages
Or rather, images that could be available, as the VO currently consists of single frequency FITS data files searchable only with difficulty through obscure Java applications or little known websites. Finding the data is tricky. Figuring out how to best convert this data into interesting and (sometimes) beautiful images is largely a combination of luck, informed guesswork and just a bit of magic.
Nevertheless, it is possible, and is a major opportunity for amateur astronomers. Professional astronomers only rarely create these images themselves. The result is that the VO has become an enormous data gold mine with untold riches waiting for those with the determination to uncover them.
A showcase
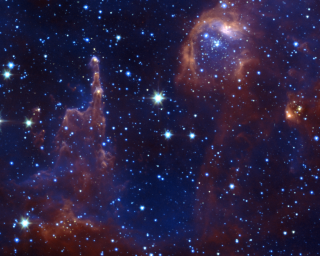
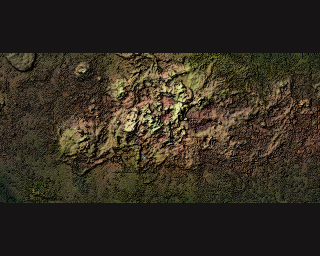
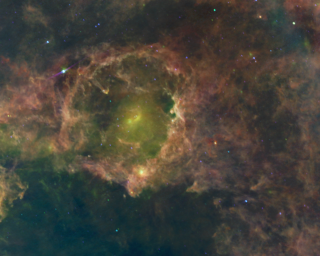 In this section of Galaxy Map, I'm showcasing some of the images I've created using VO data. I'm doing this in the hope that those with stronger artistic and/or scientific skills than mine will become inspired to do better than I have.
The images created in this section have been in part inspired and informed by the artist-astronomer Dr. Jayanne English. English's haunting image of the Cygnus X region as revealed at infrared and radio frequencies is surely one of the greatest single astronomical images of recent years. Cygnus X, the most massive star formation region in the solar neighbourhood, was a dust obscured scientific abstraction until English wove together data from four non-visual frequencies to give us a glimpse into its heart.
Although many astronomical image makers (including Jayanne English and the NASA artist-astronomer Robert Hurt) use Photoshop, I don't. I occasionally use an ancient copy of Paint Shop Pro 5 because it seems to work within my limited 2 gigs of RAM more efficiently than GIMP and often use the Aladin FITS viewer. But my main tools are command line scripts written using ImageMagick, Python and Skyview-in-a-jar.
In order to manipulate FITS files with Python, I use the Python libraries PyFITS, PyEphem, and NumPy. One major advantage of the command line approach is that I can use a similar set of tools to produce single images like those showcased here, or the huge tiled images provided through the Milky Way Explorer. In the case of the tiled images, I put my scripts in loops and let them run overnight or in some cases for several days.
Data sources
The two largest and most important astronomical data archives are MAST, which holds a lot of ultraviolet, visual and near infrared data (including that generated by Hubble), and IRSA, which includes most of the infrared data, including that generated by the Spitzer space telescope.
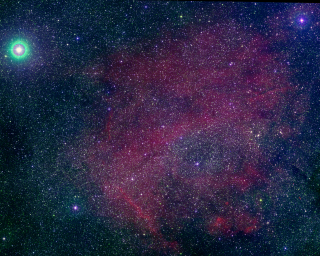 There are many other data archives besides these large ones. Four key ones are SuperCOSMOS (southern hemisphere visual data, especially in hydrogen-alpha), IPHAS (northern hemisphere visual data, especially in hydrogen alpha), CADC (radio data from several galactic plane surveys for the northern hemisphere) and SGPS (southern hemisphere radio data). There are several others that host important data as well that I'll mention when describing how I created specific images.
In these early days of the Virtual Observatory, the data archive sites all have different mechanisms for accessing their data (although fortunately it is almost all available in standard FITS format). I've already given some details describing how to access data available through IPHAS, as well as DSS and SuperCOSMOS here. I'll add more details over time.
Strange new worlds
Click on each image for larger versions and more information.
 |
 |
 |
 |
 |
 |
