Double, double toil and trouble;
Fire burn, and cauldron bubble.
William Shakespeare, Macbeth, Act 4, Scene 1
Hydrogen is the main building block of the Milky Way. It is the basic material which fuels our Sun and the stars in our night sky.
Red clouds of ionised hydrogen gas, called HII regions, are visible in many galaxies, including the Milky Way, surrounding massive star formation regions. They are described in more detail in The Cloud Hunters. Most hydrogen gas is not visible to the human eye, however. Nevertheless identifying its location is essential to constructing a map of the Galaxy.
Below we can see three images of Messier 101, the Pinwheel Galaxy, also called NGC 5457. The first is taken at visual frequencies by the Hubble space telescope, the second shows atomic hydrogen gas detected by the NRAO Very Large Array radio telescope as part of The HI Near Galaxy Survey (THINGS) and the third shows the combined data.
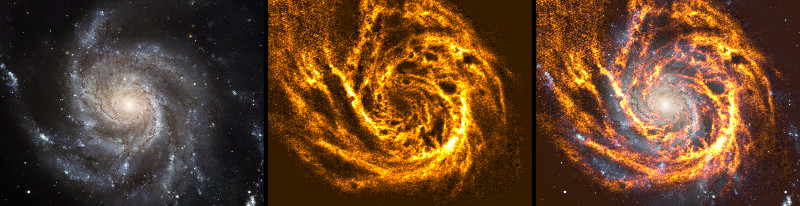
There are several striking differences between the hydrogen and visual data:
- the hydrogen data shows more detailed structure than the visual data, including many "holes" or bubbles in the hydrogen emission
- the hydrogen emission is more widespread than the visual data and shows regions of the galaxy that at visual frequencies are obscured by dust, as well as bridges or spurs that connect spiral arms, and
- nevertheless there are some regions that are more prominent at visual frequencies, most notably the galactic nucleus.
As we will see, these differences also appear in the data for our own Milky Way galaxy.
Non-ionised (neutral) hydrogen gas comes in two forms. The most common is atomic hydrogen gas consisting of individual hydrogen atoms. It can be detected by radio telescopes at a frequency of 21 cm or 1420 megahertz. A less common form, molecular hydrogen, tends to be found more in the inner galaxy. This is made up of H2 molecules made up of two hydrogen atoms bound together. Molecular hydrogen gas is far more difficult to detect, and astronomers usually detect carbon monoxide instead as that emits at several radio frequencies and is known to be located together with molecular hydrogen.
As explained in the section on Velocity, it is possible to measure the velocity of both atomic hydrogen gas and carbon monoxide and in theory this can be used to construct a map of the Milky Way assuming that the velocity of the gas is largely determined by the rotation of the galaxy. This scheme has run into difficulty for several reasons, one of which is that gas moves for other reasons than galactic rotation. For example, gas may expand away from the star formation regions, driven by enormous stellar winds. This local movement may explain the bubbles so obvious in most hydrogen maps of other galaxies.
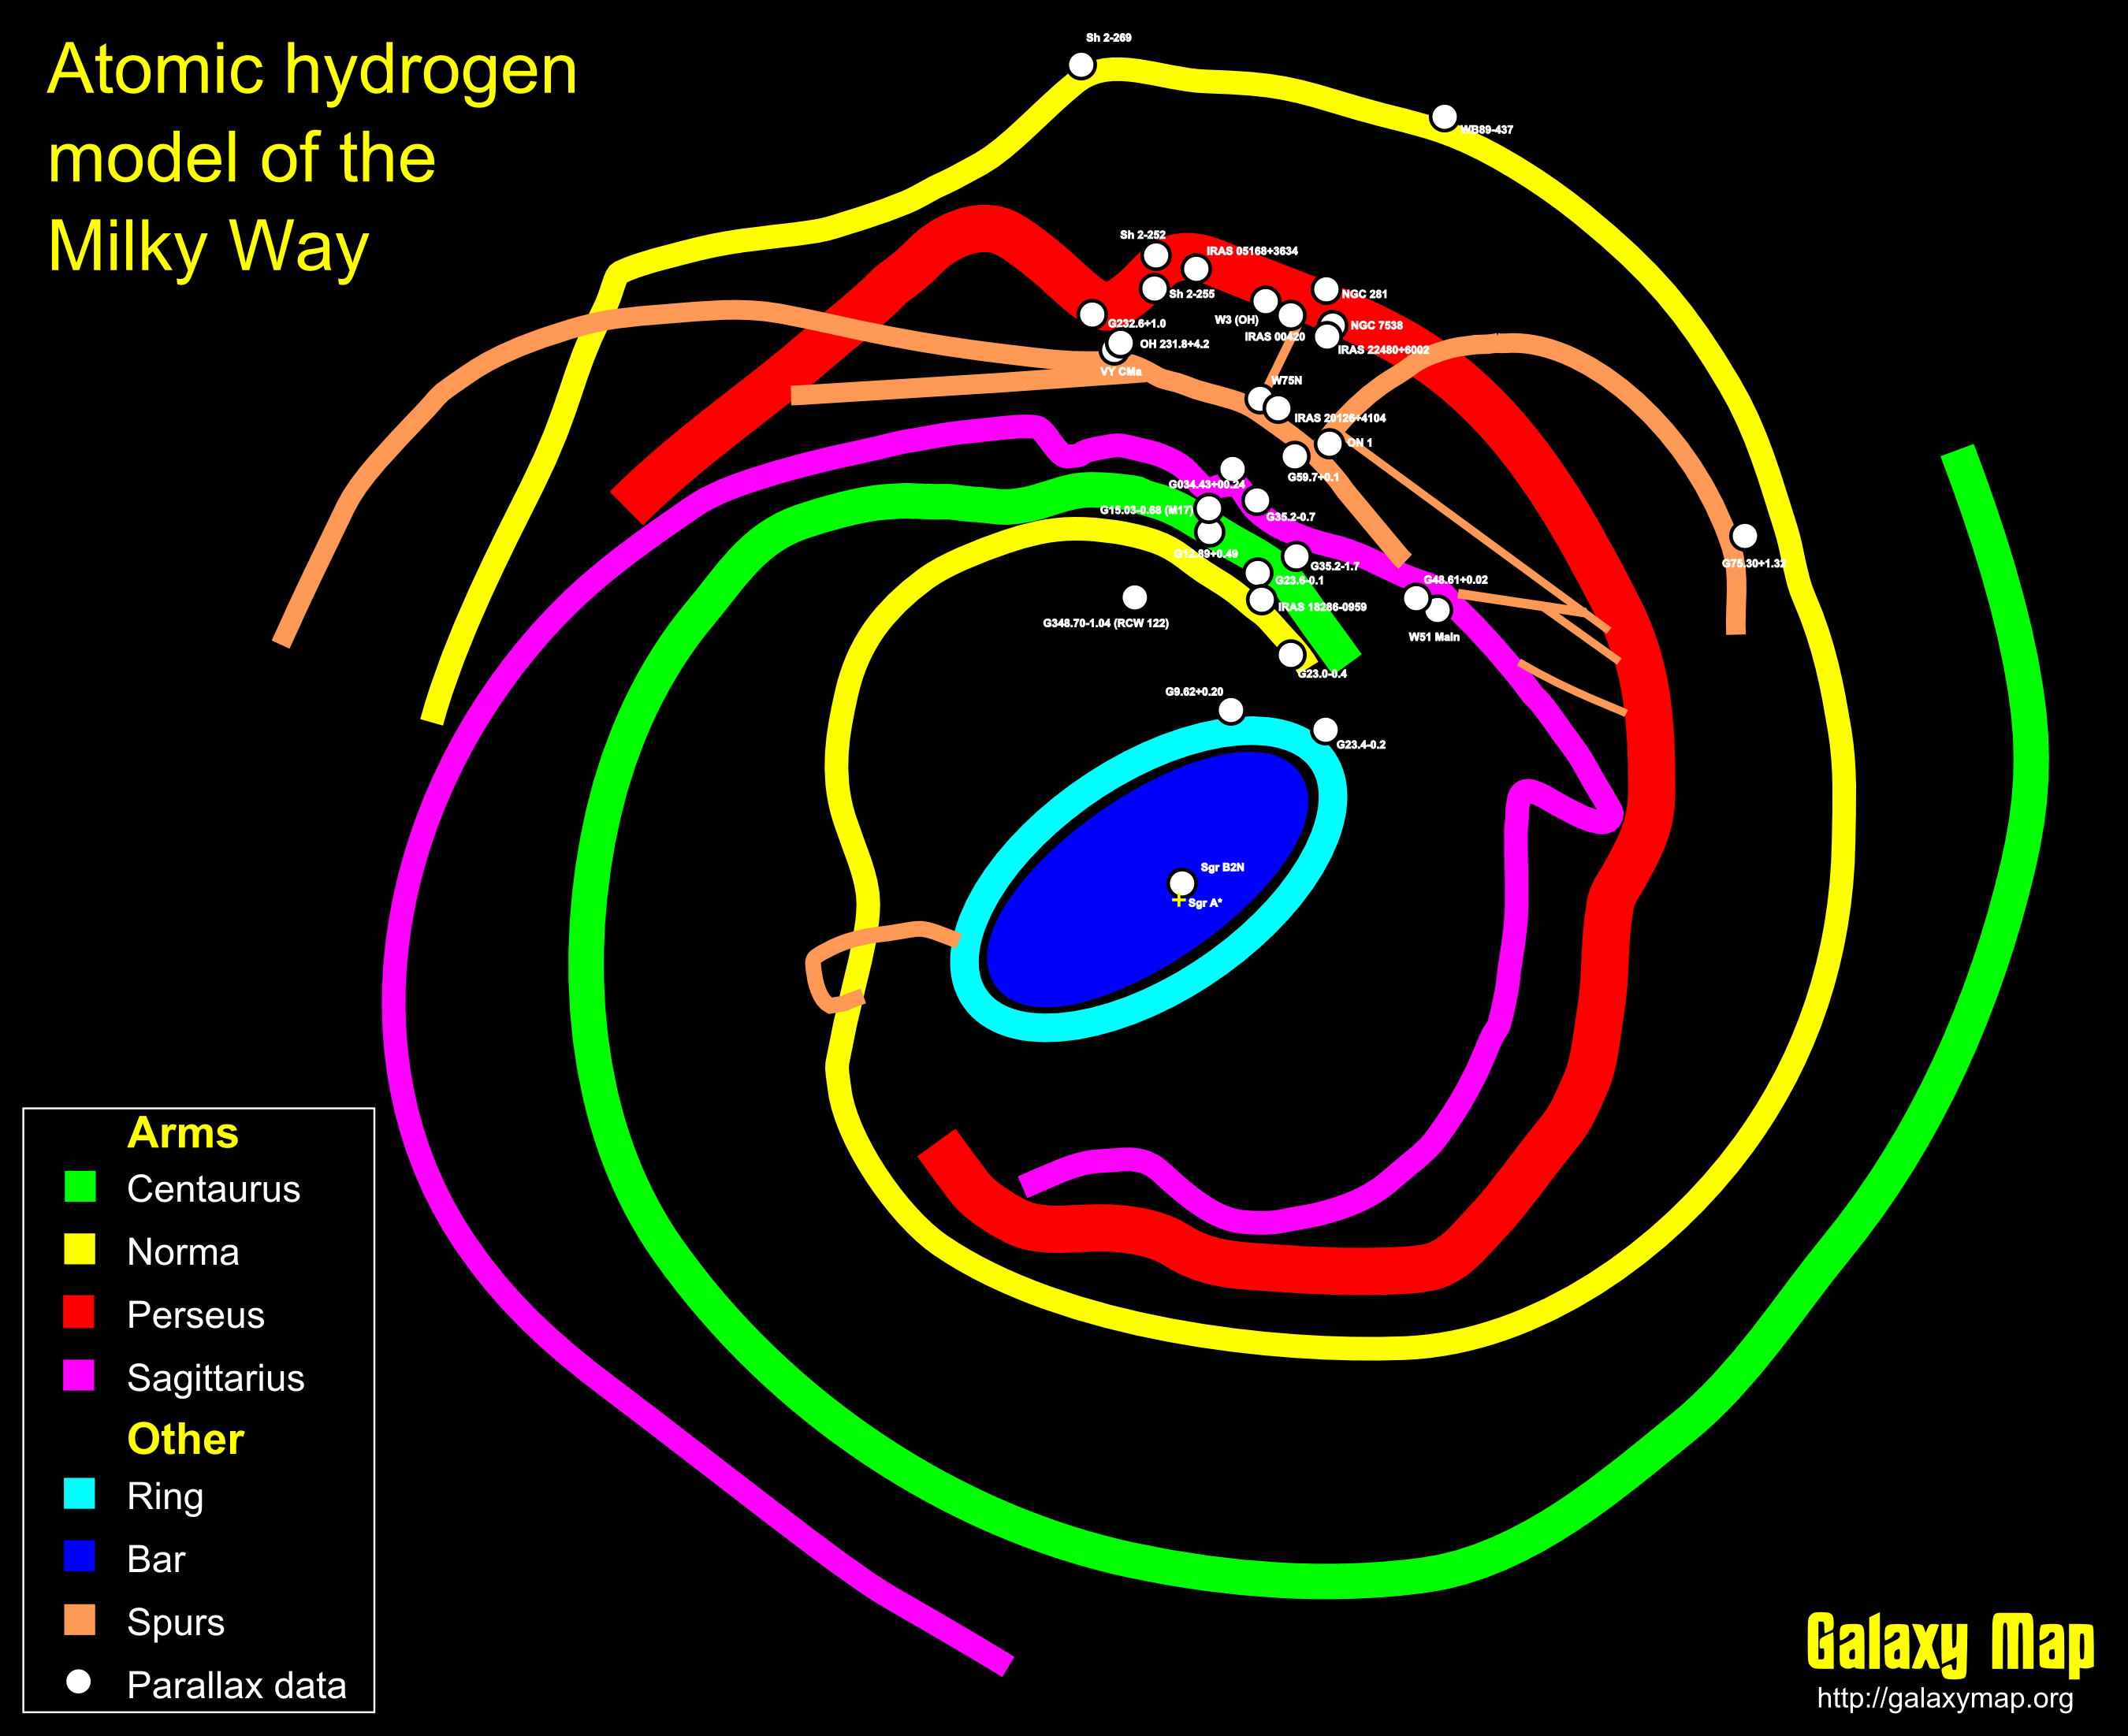
Fortunately, recently radio parallax measurements have been made of a few dozen star formation regions. Assuming that these regions tend to be found within dense regions of hydrogen gas, these measurements can be used to correct and improve maps derived from velocity measurements alone.
Below is a model of the Milky Way derived from the Leiden/Argentine/Bonn velocity survey of atomic hydrogen described in the section on Velocity. This map has been corrected where possible using the new parallax measurements for star formation regions. As you can see, all but one of the star formation regions (RCW 122) is associated with a spiral structure (arm, spur, ring or bar).
(In the Spiral structure and RCW 122 section I look at several options to incorporate RCW 122 in a revised model and conclude that the most likely is a peninsula extending from the Norma arm.)

This illustration is also available at a higher resolution and in an SVG format. The SVG file can be viewed in an SVG editor such as Inkscape.
This model has many interesting features which I'll discuss in the following sections, which also describe in more detail how the model was derived. It is important to keep in mind that this is not the only model compatible with the existing velocity and parallax data. The Near and far section shows possible variations compatible with the velocity data.
As you can see from the above illustration, the available parallax measurements are largely confined to the first and second galactic quadrants and even there are only sufficient to determine the basic layout of the Perseus arm in the second galactic quadrant. There is almost no radio parallax data for the third and fourth galactic quadrants. This is because almost all the radio parallax measurements to date have been carried out in the northern hemisphere. A much more accurate map of the Milky Way will only become possible when a larger set of radio parallax measurements becomes available, especially from southern hemisphere radio telescopes.