In the outer galaxy sufficiently far away from the centre (0°) and anticentre (180°) directions, it is possible to use the Milky Way model to derive a detailed map of the atomic hydrogen by interpolating between the identified structures, in effect stretching the velocity data like a rubber sheet. Within about 35° of the galactic centre and anticentre directions, velocity compression makes it difficult to interpolate between the spiral arms and within about 15° of the galactic centre and anticentre directions, the velocity compression is so extreme that it removes any detail from the arms themselves. In the inner galaxy, velocity blending between the near and far distances makes interpolation difficult as well.
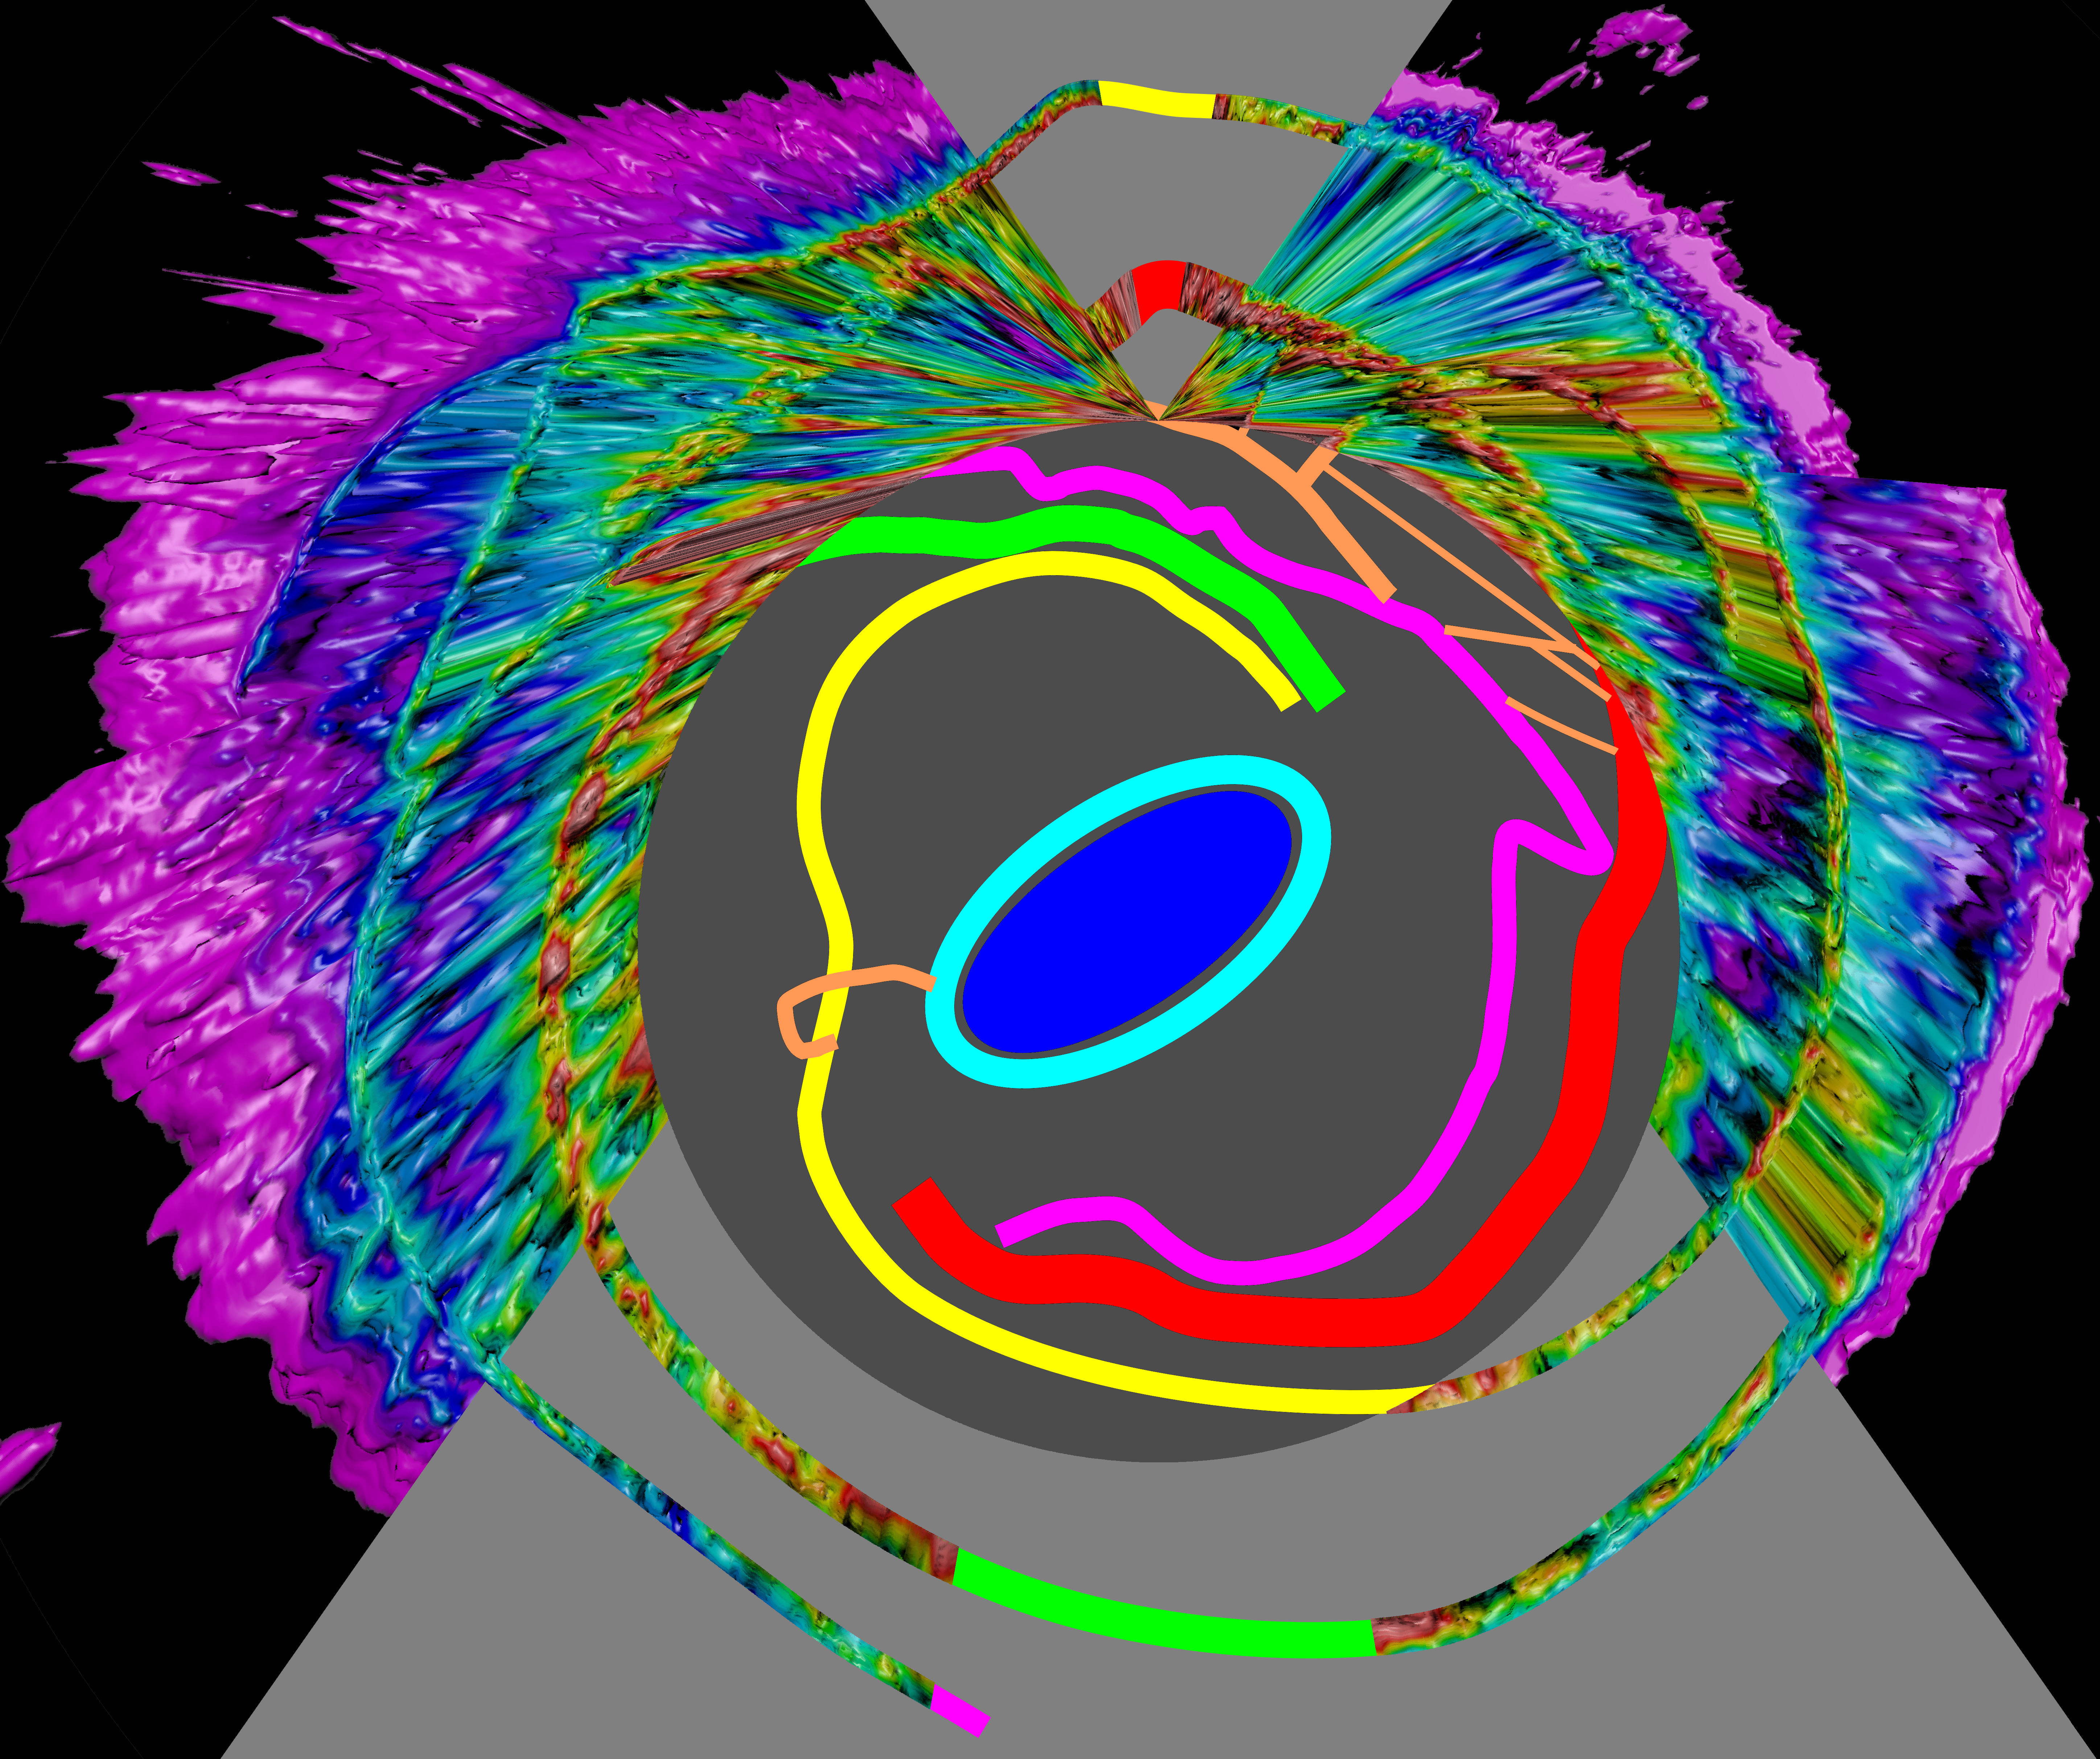
In the map below, I have displayed interpolated data where possible and the model otherwise. Light gray represents regions of velocity compression and dark gray represents the inner galaxy.
Note that the map becomes unreliable close to the solar circle (the edge of the inner galaxy, which has velocity close to 0) and some of the hydrogen displayed near the solar circle may actually be local emission close to the Sun instead.

You can explore the map in more detail using the Face On Explorer. This shows the galactic longitude and distance from the Sun for the current mouse location in the lower right. You can also cross fade between the map and model to make it easier to see the location of spiral structures. In addition to the Face On Explorer, you can also download large labelled and unlabelled map images.
The Face On Explorer can also be used for molecular hydrogen. Even though most molecular gas is concentrated in the inner galaxy (and so not included in the map), this image reveals concentrations of molecular gas in the outer galaxy as well. You can cross fade to compare the molecular and atomic gas.
This map reveals that there are many short spurs or "feathers" connecting adjacent spiral arms throughout the Milky Way, as predicted in models of spiral galaxies. (For example, see figure 1 from C. L. Dobbs, J. E. Pringle 2013.)