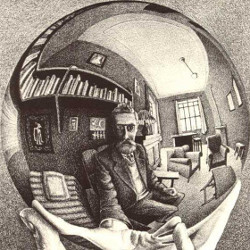
The mathematics converting Milky Way velocity to distance is more distorting than a mirror in an amusement park or Escher print.
Ever since Isaac Newton broke sunlight into a rainbow with a glass prism, scientists have realised that light and other forms of electromagnetic radiation contain hidden information. Research has shown that radiation can be used to determine the temperature, chemical composition and even the velocity of the objects that emit it.
A distorted mirror
Astronomers have long sought to combine two crucial pieces of information: the fact that the Milky Way galaxy rotates and the fact that atomic hydrogen releases radio emission at a wavelength of 21 cm, to produce a map of the galaxy.
The reasoning is that the overall velocity of hydrogen gas in the Milky Way must be determined by the rotation of the galaxy and so if we can use precise radio measurements to determine the velocity of the gas relative to the Sun and we have an accurate rotational model of the Milky Way, we can turn velocity measurements into distance measurements and so create a 3D map of the galaxy.
This grand dream, called kinematic distance estimation, has run into two main difficulties:
- The Milky Way does not in fact have a simple rotational model. The two inner spiral arms, called the near and far 3kpc arms, are expanding away from the central bar at about 50 kilometres per second. The gas in the Perseus arm streams along the arm as well as rotating with the galaxy. Increasing evidence suggests that stars and other denser objects may rotate at a different speed than the cold gas.
- The mathematical models that convert velocity to distance always have two possible values for any object closer to the galactic centre than the Sun. It is sometimes difficult to choose between these near and far values. Moreover, simple rotational models squeeze the radial velocity of all objects in the direction of the centre of the galaxy (0° galactic longitude) and its opposite, "anticentre" direction, 180°, down to zero. This velocity blending and velocity compression are more distorting than a mirror in an amusement park or an Escher print, making reconstructing the original map a major challenge.
Other options
There are two other major distance estimation techniques, parallax and photometric estimates, but both have their own problems. The gold standard, parallax is the most accurate. Recent breakthroughs in radio astronomy have allowed parallax measurements at least as far away as the central bar, but the measurements are time consuming and so far distances to only a few dozen distant objects have been completed. The Gaia satellite, launched in December 2013, should measure parallax for up to a billion stars, producing much more detail, but only for unobscured stars in a large region on the near side of the galaxy.
Photometric estimates use data on the temperature of stars and by comparing their observed brightness to their temperature, attempt to estimate their distance.
Both Gaia and photometric techniques require observing stars, which are often obscured by dust or too far away to observe accurately. Velocity measurements, on the other hand, are available for hydrogen gas even on the far side of our galaxy.
It seems likely that a full map of the Milky Way will be completed only by combining radio parallax and kinematic techniques. Radio parallax measurements could be used to calibrate and correct the mathematical models used to convert velocity data into distances.
Looking into the mirror
To provide more insight into the distortions caused by the mathematical models that convert velocity into distance (and vice versa), I have created a web animation. The animation, which is available here, requires a modern HTML5 browser and probably will not work with Internet Explorer. It has been tested with Firefox, Chrome and Safari. It works best on a large display. You may wish to view it in full screen mode.
The animation consists of three images.
The first image shows the eight major components contained in standard models of the visible disk of the Milky Way. These are the four main spiral arms, the central bar, the two inner near and far 3kpc arms that ring the central bar, and the Orion spur, the structure located between the Sagittarius and Perseus arms within which our own Sun is located.
The second image shows how those components would get converted into a velocity map given a very simple rotational model of the Milky Way. This model assumes that the distance between the Sun and the centre of the galaxy is 8000 parsecs and that every part of the galaxy rotates at exactly the same speed: 210 km/s.
If you click on one of the components in the first image, the second image will change to show how it would appear in a velocity map. If you click away from these components, the second image will again show the blended results of all eight components. As you can see, the inner galaxy gets mapped to overlapping parts of the velocity image, and all the objects in the directions of the galactic centre and anticentre get mapped to a single point.
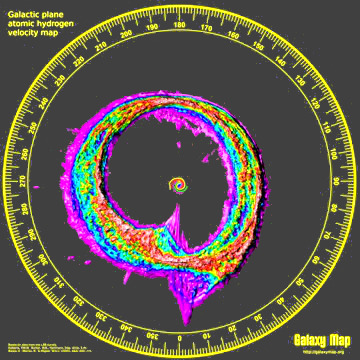
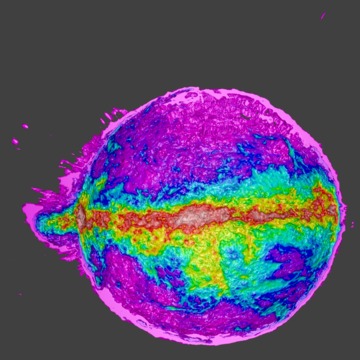
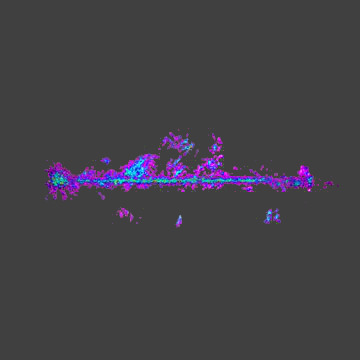
The third image is an actual velocity map of the Milky Way constructed using data from the LAB HI survey of atomic hydrogen gas. There are many differences of detail between the actual velocity map in the third image and the theoretical velocity map in the second image, but what is striking is that the overall pattern is remarkably similar, despite the extreme simplicity of the rotational model used to create the second image.
It was an enormous surprise when astronomers discovered that most hydrogen gas in the Milky Way rotates about the galactic centre at approximately the same rate. This is in sharp contrast to planets in our solar system, where the outer planets rotate around the sun much more slowly than the inner planets. The most popular explanation for the peculiar behaviour of the Milky Way (and other galaxies) is large amounts of the mysterious dark matter.
By comparing the three images, you can see that all eight components of the standard model of the Milky Way are reflected in the real velocity data, and indeed velocity measurements of atomic hydrogen are what led to the creation of the standard model in the first place.
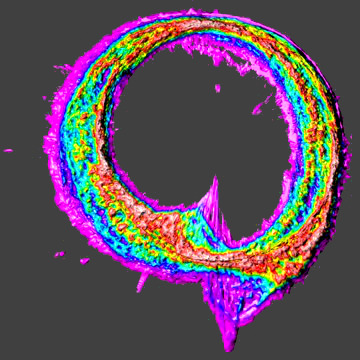
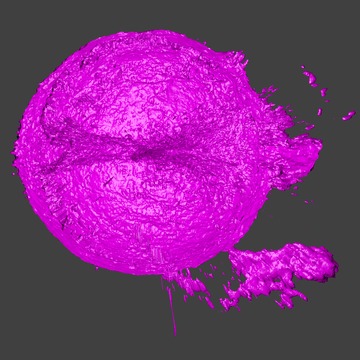
Velocity images
The third velocity image and a number of other images are available below in much greater detail.
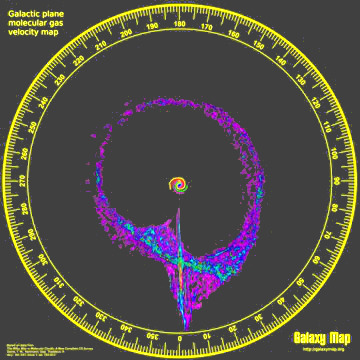
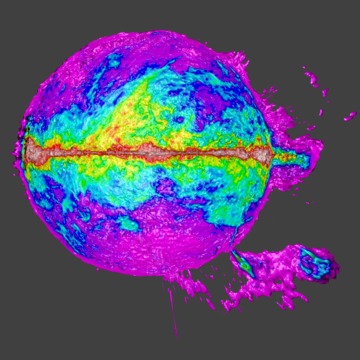
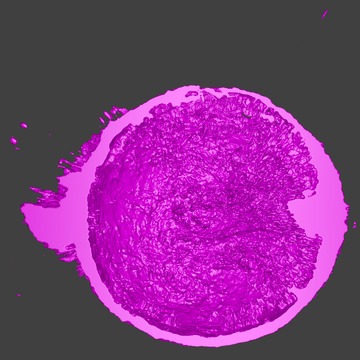
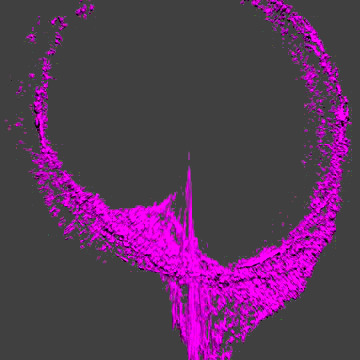
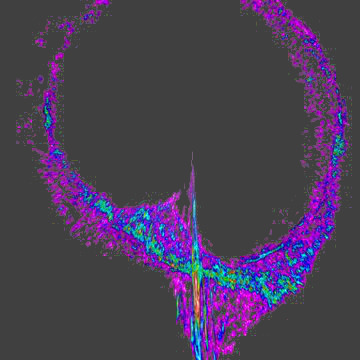
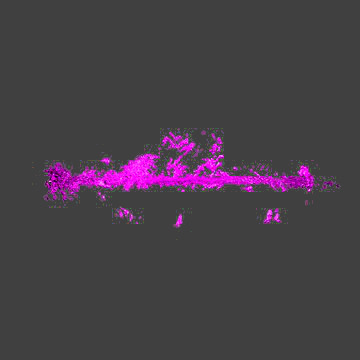
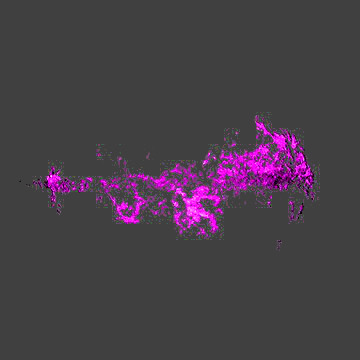
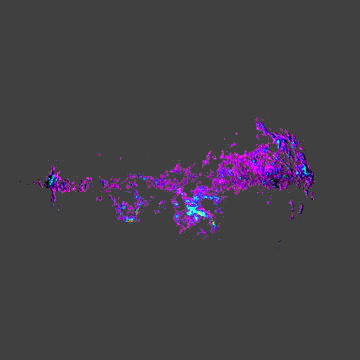
The images were constructed using either the LAB HI atomic hydrogen survey mentioned above or a second survey of molecular gas.
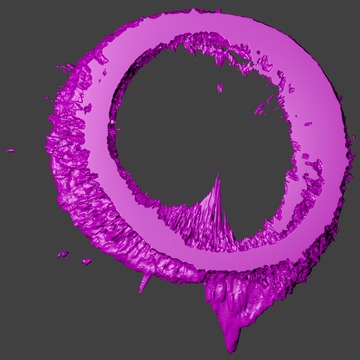
In all cases the images were created in Blender from 3D meshes generated from the velocity data using a marching cubes algorithm to create isosurfaces of constant gas temperature.
The marching cubes algorithm is most often used by medical researchers and technicians to convert MRI scans into 3D models of the brain and other tissues. Recently astronomers have become interested in applying the same techniques to astronomical objects.
Each of the thumbnails below leads to a separate page with a larger preview image and a caption. Each page also has a download link to a much more detailed full size image, which is many thousands of pixels in width and height.
| Posters | |
 |
 |
| Atomic hydrogen | |
 |
 |
 |
 |
 |
 |
| Molecular gas | |
 |
 |
 |
 |
 |
 |