The Mountains of Tycho

Submitted by Kevin Jardine on 26 October, 2016 - 09:50

Suppose that you wanted to make a map of Europe and all you had was a satellite image taken at night. You might start with something like the image below.

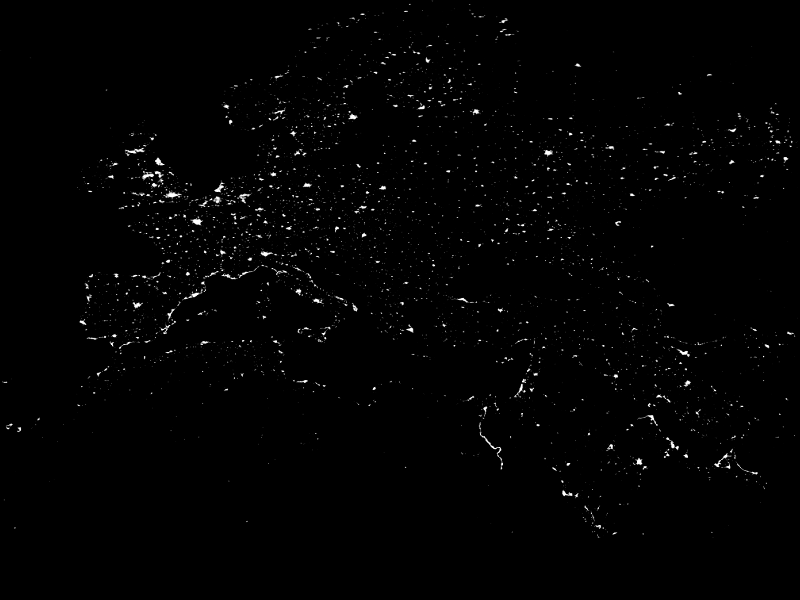
If you did a careful analysis of the distribution of the lights, you could extract quite a bit of information from this image, including the location of major cities and most of the coast line.

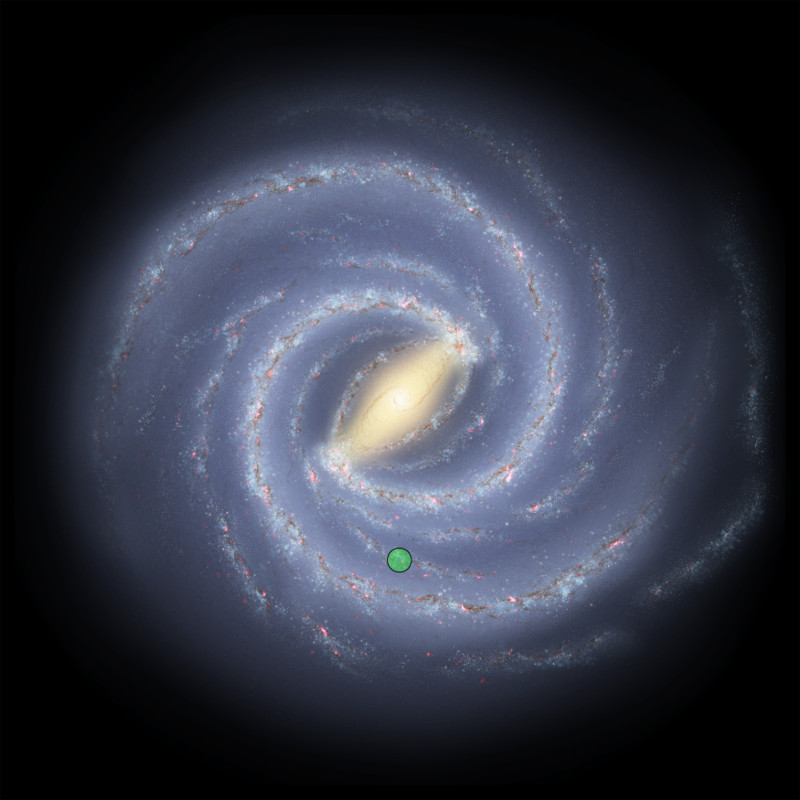
We have a similar situation with the TGAS data set. The distribution of the stars, especially the hotter stars, is by no means random. Using some mathematical tools, we can extract quite a bit of information about the solar neighbourhood out to about 800 parsecs (beyond this distance, the limited accuracy of the parallax measurements for even the brightest stars makes them impossible to place on a map).

One key tool is temperature density. The Tycho-2 catalog provides B and V magnitudes for almost all the stars. The difference B-V is called the colour index and it can be used to estimate the temperature of a star.

We are more likely to find structures to map using the hotter stars because these tend to be younger and younger stars are located close to the star formation regions within which they were born. (We can think of a star formation region as analogous to a city in a map of Earth.) Older, cooler stars often drift in random directions from their origin over time and so are less useful for mapping purposes.

Astronomers usually use the hottest O and B class stars to map star formation regions. These correspond to B - V < 0. However, I've been a bit more generous in my analysis because stars embedded in dust clouds can be reddened, increasing their colour index. So I've selected all the Tycho-2 stars with B-V < 0.1 to include some of the reddened B-class stars. In some cases this pulls in some hotter A-class stars but that should make little difference for the analysis.

I've interpolated Eric Mamajek's very useful table to convert colour index to effective temperature.

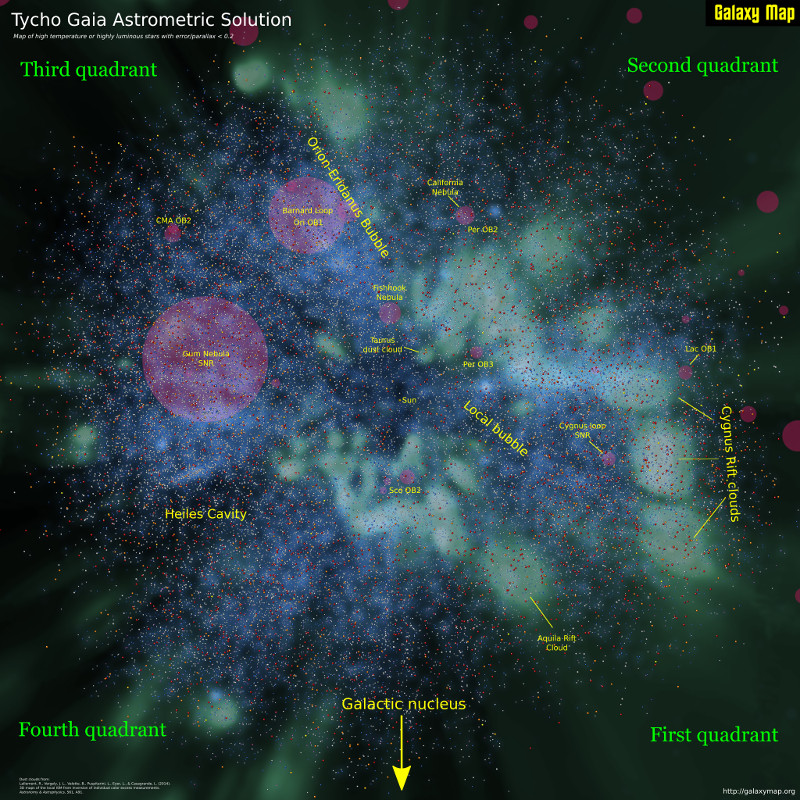
As usual, I am starting with the approximately 1 million stars in the TGAS data set with err/parallax < 0.2 for the reasons explained in my previous blog post on TGAS limitations.

In order to find structures, you have to have a way to aggregate individual star data. I've done this in two steps:

  • Bin the data
  • Smooth the data

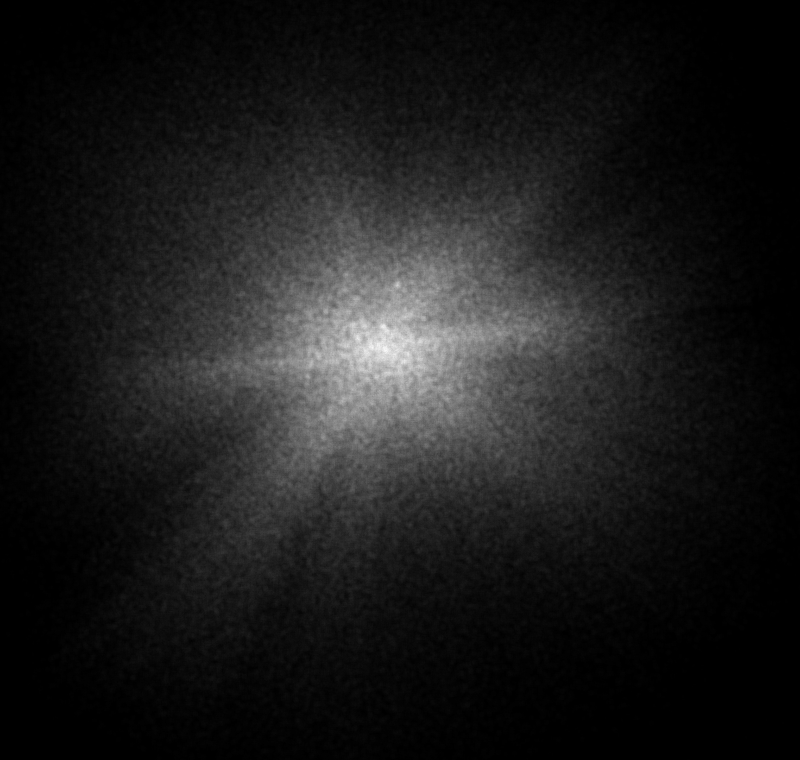
In my first experiment, I calculated the x, y and z values in parsecs relative to the Sun. I defined my bins as all the stars with the same integer x and y values. For this first experiment, I ignored the z value, so this adds together all the stars with the same x and y parsec values above and below the galactic plane regardless of their z-height. I then added together the temperatures for all the stars in each bin with B-V < 0.1.

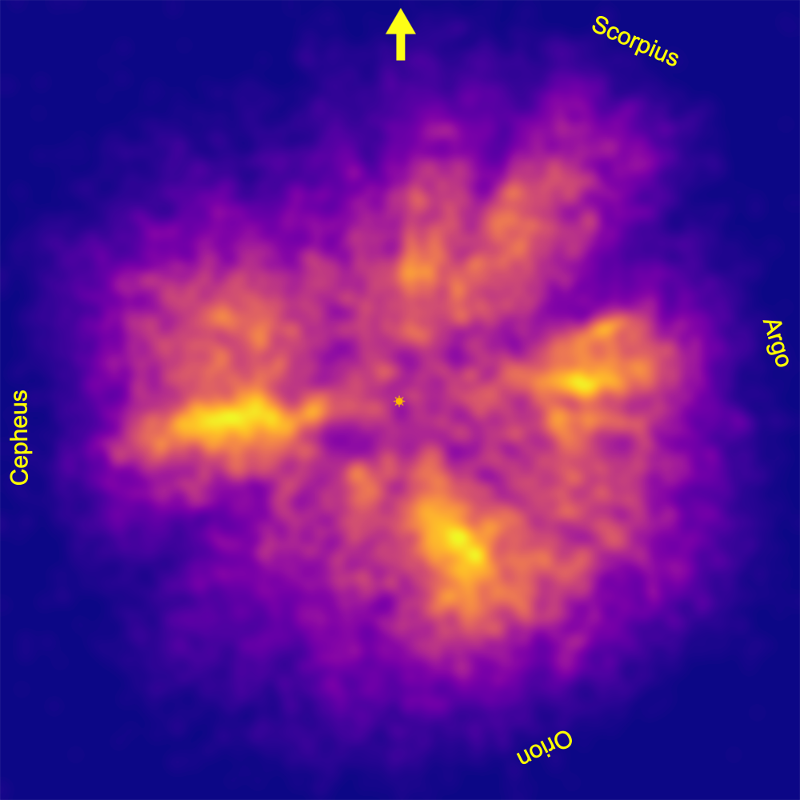
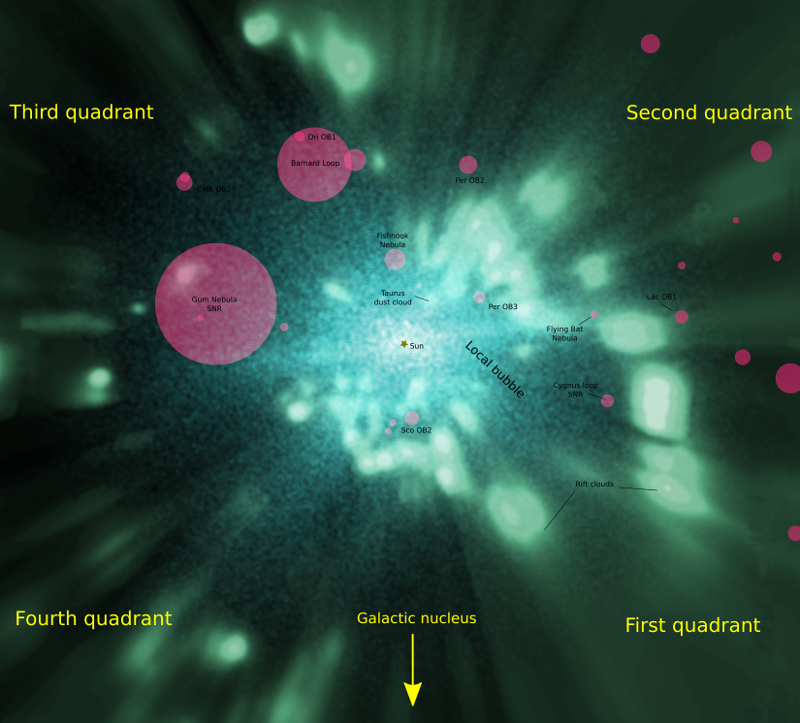
To smooth the data, I started by taking the square roots of the temperature sums to reduce the spikiness of regions with a lot of hot stars. I then used gaussian smoothing with a sigma (standard deviation) of 15 parsecs. The result of my first experiment is below. I have added the position of the sun at the centre, an arrow pointing in the direction of the galactic nucleus, and names for each of the four identified hot star concentrations. The full image (right to the edge of the rectangle) is 800x800 pc. You can see that the hot star density drops well before 800 pc.

It is much easier to visualise these density distributions as height maps, so I created and animated one in the 3D graphics application Blender. You can see the result on Youtube:

(I suggest going to full screen and right-clicking on the video to set the loop option as the animation is fairly fast.)

There are some surprising structures visible in these images, especially in the hot star concentration that I labelled Cepheus. I'll discuss some of them in my next blog post.

TGAS Limitations

Submitted by Kevin Jardine on 16 October, 2016 - 18:02

The Tycho-Gaia Astrometric Solution (TGAS) star parallax catalog, released as part of Gaia DR1 on September 14, 2016, was created by combining star position data from the Tycho-2 catalog (produced in the late 1990s) with observations from the first few months of Gaia observations. Because of the short scanning period and the dependence on older observations, it has a number of limitations.

The most obvious of these limitations is the accuracy of the data.

An important paper published in 2015, Bailer-Jones, Coryn AL. "Estimating distances from parallaxes." Publications of the Astronomical Society of the Pacific 127.956 (2015): 994 (read in arXiv), concludes that converting parallax measurements with errors to distances is not straightforward unless the estimated error/parallax ratio is < 0.2. If the error/parallax ratio is higher, not only are the results less reliable, but the formula depends upon a model of the distribution of the stars in the Milky Way. In other words, to place these higher error stars on a map, you essentially already have to have a map!

Is the lack of bright stars near the Sun real or a TGAS limitation? (View in Tycho Galaxy)

Half the TGAS stars have a parallax error of 0.32 mas according to the Gaia DR1 documentation. Plugging this error into Bailer-Jones's formula shows that most of the TGAS results can only be reliably placed on a map for distances less than 625 parsecs (about 2000 light years). The green disk in the image above shows this distance superimposed on an artist's model of the Milky Way. As you can see, 625 parsecs only covers the solar neighbourhood and does not even reach any of the galaxy's major spiral arms.

There are more limitations than this. According to the DR1 release notes:

  • Many bright stars at G≲7 are missing from Gaia DR1;
  • Sources close to bright objects are sometimes missing;
  • High proper motion stars (μ>3.5 arcsec yr-1) are missing;
  • Extremely blue and red sources are missing;

The net effect is that no naked eye stars and few stars close to the Sun are included in TGAS (and therefore appear on Tycho Galaxy). This might explain the odd dearth of bright stars near the Sun in the Tycho Galaxy map of the solar neighbourhood.

There is even more bad news. In addition to the 0.32 mas parallax measurement error for most of the TGAS stars, the Gaia DR1 release notes warn that the Gaia data may have a systematic error and that this error might be as high as 0.3 mas. If we add this to the 0.32 mas measurement error, Bailer-Jones's formula gives us a usable distance of 323 parsecs. This is not even as far as the Orion nebula and not that much further than the Hipparcos results from the 1990s.

I have ignored the possible systematic error in producing Tycho Galaxy but it does place a question mark over much of the map.

Another limitation is caused by Gaia's incomplete sky scans during the DR1 period. As the Gaia data that went into TGAS was gathered only over the first few months of the mission, some of the sky was not completely scanned. Gaia scientist Ronald Drimmel tweated the incompleteness maps:

So am I disappointed with all this? Not really. The scans will be completed and the naked eye and high proper motion stars will be added to a future release. Moreover, the science goal of the Gaia mission is to produce parallaxes with an error of 0.0067 mas for the brighter stars. This is smaller than the size of a euro coin on the moon as seen from the Earth, and is fifty times more accurate than achieved for the TGAS release.

The Gaia scientists say that with more observation and calibration, the mission is still on track to achieve this high accuracy over the next few years. Plugging this reduced error into Bailer-Jones's formula gives us a usable distance that is larger than the entire galaxy. Clearly, the real limitation is the brightness of the stars as seen from Gaia. For those stars not embedded in thick dust clouds, the effective range of Gaia will include about a billion stars distributed through most of the Milky Way on this side of the galactic nucleus.

That is a big map.

The Stars, Like Dust

Submitted by Kevin Jardine on 14 October, 2016 - 13:15

The stars, like dust, encircle me
In living mists of light;
And all of space I seem to see
In one vast burst of sight.

Isaac Asimov

September 14, 2016 was the day when everything changed in astronomy with the release of parallax estimates for more than 2 million stars. My last few blog posts have covered the momentous release of the Tycho-Gaia Astrometric Solution (TGAS) as part of Gaia DR1.

Today I have put up the Tycho Explorer, a zoomable, pannable, clickable interface to the Tycho-2 catalog, both as it appears in the sky (Tycho Sky) and as it appears as a face-on map of the galactic plane (Tycho Galaxy).

Tycho Sky includes 2.5 million stars from the Tycho-2 catalog with provided B and V magnitudes (which is almost all of them), and Tycho Galaxy includes more than a million of these stars with reasonably low parallax errors (measured error/parallax ratio < 0.2) stretching out to a distance of about 700 parsecs (2300 light years). At the highest zoom level you can click on each star to get more information and use links to see the star in Tycho Sky and Tycho Galaxy. Search boxes enable you to zoom into a star in the maps by entering an identifier.

Much more information about both the sky and face-on Tycho viewers can be found by clicking the Help links at the upper right of the viewers. The Tycho Explorer is still very much in beta. The infrared background to Tycho Sky has a number of artifacts and limitations, and not all the functions work yet on mobile devices. TGAS itself does not include any naked eye stars or many stars close to the Sun. I'll mention the limitations in more detail in my next blog post.

The Tycho Explorer will continue to improve and the next Gaia data release at the end of 2017 will have more and more accurate data.

Despite the limitations, the results are already amazing. We are on the verge of the greatest mapping project in human history - one that dwarfs that of the New World. The Milky Way is appearing in all its glory before our eyes.

You can download a 4K wallpaper image of some of Tycho Galaxy here (warning, 10 Mb file).

Update: I think I have fixed the issues for mobile and the Tycho Explorer should now work for Android and iOS devices. The interface is not very convenient for small screens (I recommend a large monitor - it looks spectacular on my 4K Philips monitor). If there is demand I might work on a tailored interface for phones.

The code is now in GitHub: https://github.com/kevinjardine/galaxymap. Contributions are welcome.

TGAS high temperature / luminosity map

Submitted by Kevin Jardine on 16 September, 2016 - 17:07

I've now created the first real face-on map/poster from the Tycho Gaia Astrometric Solution (TGAS) data set that was part of Gaia DR1. The download links for the full resolution version are at the end of this blog post.

TGAS contains parallax data for about 2 million stars, which is most of the Tycho-2 catalog.

Of this data, about half has an error/parallax ratio < 0.2, which is very good. (Keep in mind that this is the precision of the specific measurements. The Gaia DR1 documents warn that in addition the data has a systematic error which is unknown but could be as high as 0.3 milliarcseconds. If the systematic error is really 0.3 milliarcseconds, this would throw off much of the map, especially the regions beyond 300 parsecs. I'm ignoring that for now. In any case, I'll redo all my Gaia maps after DR2 comes out towards the end of 2017. For now, TGAS is the best we have.)

The data with error/parallax ratio < 0.2 goes out to about 700 parsecs or so. The map has a radius of 800 parsecs, which includes pretty well all of the Gould Belt. So this map really shows pretty well all of what most astronomers would consider the solar neighbourhood.

This first map shows only a tiny fraction of the data set: stars with a colour index < 0.1 (meaning that they are very high temperature) or an absolute magnitude < -2 (meaning that they are very luminous). These are the spectacular galactic beacons that might be used as way points in some distant future. There are 50269 of these stars in TGAS with an error/parallax ratio < 0.2.

As this is a map and not just a data dump, I have provided a background to provide some context. The most important background is the face-on dust cloud map provided by this wonderful paper:

Lallement, R., Vergely, J. L., Valette, B., Puspitarini, L., Eyer, L., & Casagrande, L. (2014). 3D maps of the local ISM from inversion of individual color excess measurements. Astronomy & Astrophysics, 561, A91.

which is essential reading for any Milky Way cartographer. This is shown in green.

I have also provided a few of the larger HII regions from the Sharpless, Gum and RCW catalogs. These are shown as red circles.

Finally, I used TGAS itself to create a blue background - this is a weighted density map . Basically what this does is cut the Milky Way into cylinders that go above and below the galactic plane and have a radius of 10 parsecs. I then take the weighted mean of all the stars with a colour index < 0.1 within each cylinder (weighted by the star's estimated temperature) and use the resulting mean with a centre of each parsec to create a luminosity value. Finally I smooth the result using a gaussian blur with a radius of 20 parsecs.

This all sounds complex but takes very little time to do with Python's wonderful scipy/numpy packages.

In a nutshell, the blue background shows where the hot stars are concentrated. These are typically young stars that have not drifted yet from their places of origin.

You can download the full 8192x8192 pixel map poster here (warning, files sizes are a bit over 30 Mb):

This is just a start - eventually you can expect to see a searchable, zoomable, pannable, clickable face-on map of a million TGAS stars on this site but that will take a little more time to pull together.

First Gaia face-on map

Submitted by Kevin Jardine on 14 September, 2016 - 17:38

This is not a "real" finished map, but it was interesting to select the stars in the Gaia DR1 TGAS release with a error/parallax ratio of less than 0.2 and project a density value onto a face-on map as seen from above the Milky Way.

You can view a higher resolution version by clicking here.

This map has HII regions taken from the Sharpless, Gum and RCW catalogs and dust clouds taken from a recent 2014 paper, 3D maps of the local ISM from inversion of individual color excess measurements from Lallement, Vergeley, Valette, Puspitarini, et.al.

Here is the density map by itself:

The dust clouds in the face on map have obvious finger-like projections caused by a lack of data, but it is interesting that even the TGAS density map has these projections. I'm not sure if this is an artifact in the Tycho-2 catalog or in the way Gaia collected its first round of data.

There may be real practical limits for collecting data at visual frequencies in some directions (such as much of the first quadrant) caused by thick dust clouds. Perhaps we will not have fully complete maps until an infrared equivalent to the Gaia mission, which can see through those clouds.

Not surprisingly, the highest star density is in the Local Bubble surrounding the Sun as well as the Heiles cavity in the third and fourth quadrant as they are both relatively easy to observe.

Still, it looks like there are a reasonably large number of accurate measurements even as far away as the Barnard Loop and Orion nebula, so I am going to be working on much more detailed maps soon.

It turns out that the error/parallax < 0.2 condition is true for a million stars (half the TGAS stars) so there are plenty of reasonably accurate measurements to work with.

(For anyone wondering how I created the density map, it shows the mean number of stars in cylinders with a radius of 5 pc in the galactic plane and includes all TGAS stars from the top to the bottom of that section of the galaxy.)

Pages

Subscribe to Galaxy Map RSS