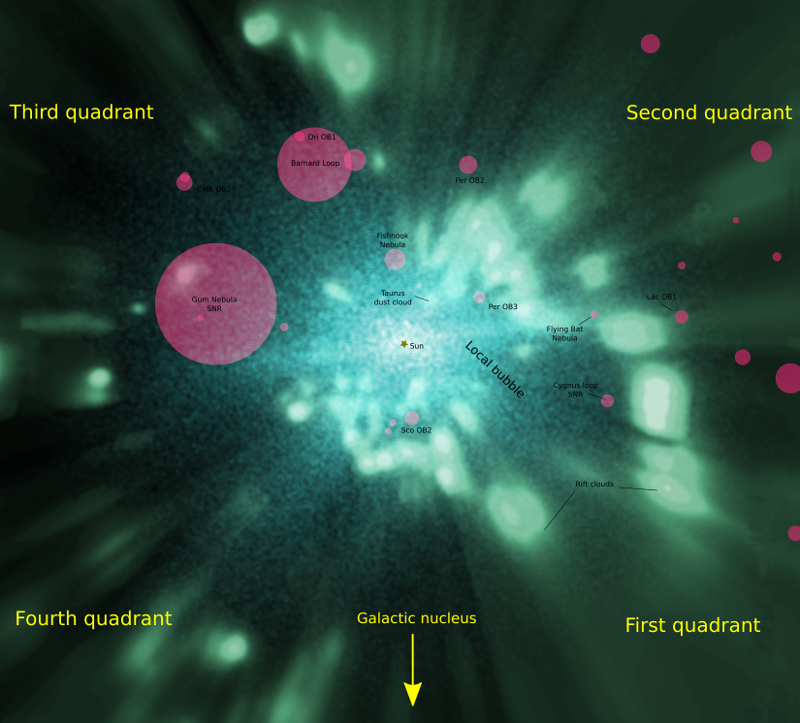
This is not a "real" finished map, but it was interesting to select the stars in the Gaia DR1 TGAS release with a error/parallax ratio of less than 0.2 and project a density value onto a face-on map as seen from above the Milky Way.
You can view a higher resolution version by clicking here.
This map has HII regions taken from the Sharpless, Gum and RCW catalogs and dust clouds taken from a recent 2014 paper, 3D maps of the local ISM from inversion of individual color excess measurements from Lallement, Vergeley, Valette, Puspitarini, et.al.
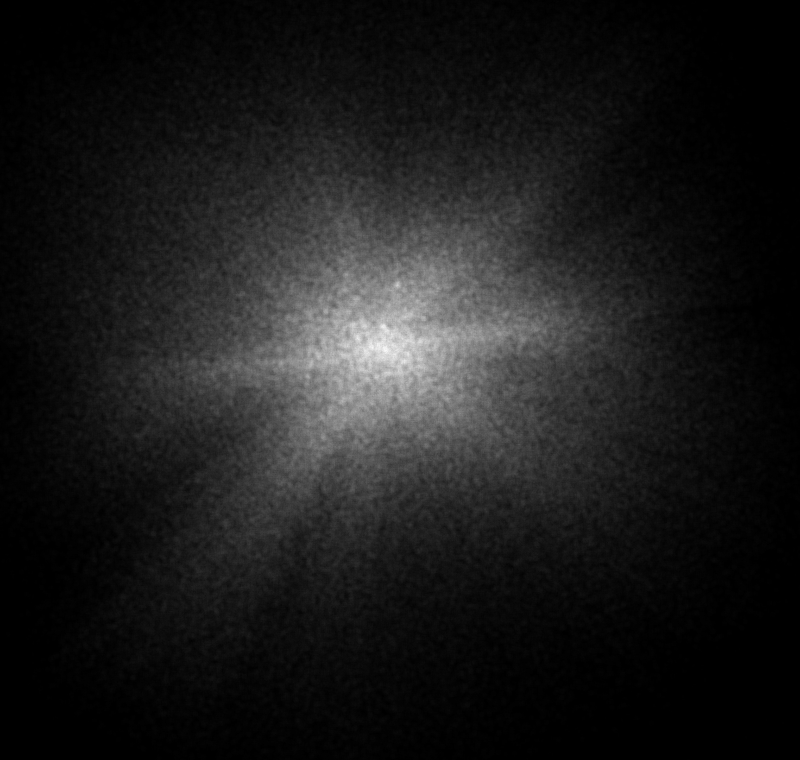
Here is the density map by itself:

The dust clouds in the face on map have obvious finger-like projections caused by a lack of data, but it is interesting that even the TGAS density map has these projections. I'm not sure if this is an artifact in the Tycho-2 catalog or in the way Gaia collected its first round of data.
There may be real practical limits for collecting data at visual frequencies in some directions (such as much of the first quadrant) caused by thick dust clouds. Perhaps we will not have fully complete maps until an infrared equivalent to the Gaia mission, which can see through those clouds.
Not surprisingly, the highest star density is in the Local Bubble surrounding the Sun as well as the Heiles cavity in the third and fourth quadrant as they are both relatively easy to observe.
Still, it looks like there are a reasonably large number of accurate measurements even as far away as the Barnard Loop and Orion nebula, so I am going to be working on much more detailed maps soon.
It turns out that the error/parallax < 0.2 condition is true for a million stars (half the TGAS stars) so there are plenty of reasonably accurate measurements to work with.
(For anyone wondering how I created the density map, it shows the mean number of stars in cylinders with a radius of 5 pc in the galactic plane and includes all TGAS stars from the top to the bottom of that section of the galaxy.)
