You are here

Blogs

Gaia mapping resources and data sources

Submitted by Kevin Jardine on 13 January, 2020 - 20:05

Below is a list of map resources, a brief description of how they were derived, and a bibliography of data sources.

Latest full zoomable map

This zoomable map goes out to a radius of 6000 parsecs (about 20 thousand light years)

http://gruze.org/galaxymap/map_2020/

Here is a zip with the background image and an SVG file with all the labels:

http://gruze.org/galaxymap/map_2020/svg_release.zip

Map out to 800 parsecs with star density clumps and optional luminous star overlay

Includes zoomable online maps, pdfs and SVG source.

Described here:

http://galaxymap.org/resources/

Meshes

Here is a zip with all the meshes used to create the maps:

http://gruze.org/galaxymap/meshes/meshes.zip

Blender file

Here is a zip with the above meshes, plus appropriate camera, lighting and materials in a .blend file:

http://gruze.org/galaxymap/map_2020/galaxy_map_2020.zip

Object data

Here is a csv file with raw data for 157 masers, 2082 open clusters, 232 HII regions and 86 OB associations that appear on the maps:

http://gruze.org/galaxymap/map_2020/map_object_list.csv

License

All materials released under the Creative Commons By Attribution 4.0 license.

Credit: Kevin Jardine (Twitter: @galaxy_map)

Overview

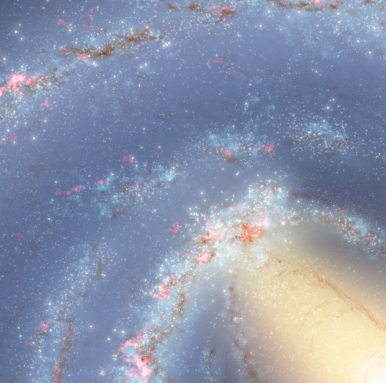
How do you map 1.7 billion stars?

Here's a recent presentation that tries to answer this question. More detailed references can be found below:

The revolutionary Gaia DR2 release on 25 April 2018 contained an amazing amount of information that is a challenge to visualize.

Simply displaying the stars would be worse than an image of a Sahara sandstorm. Fortunately, there is another alternative.

The game plan

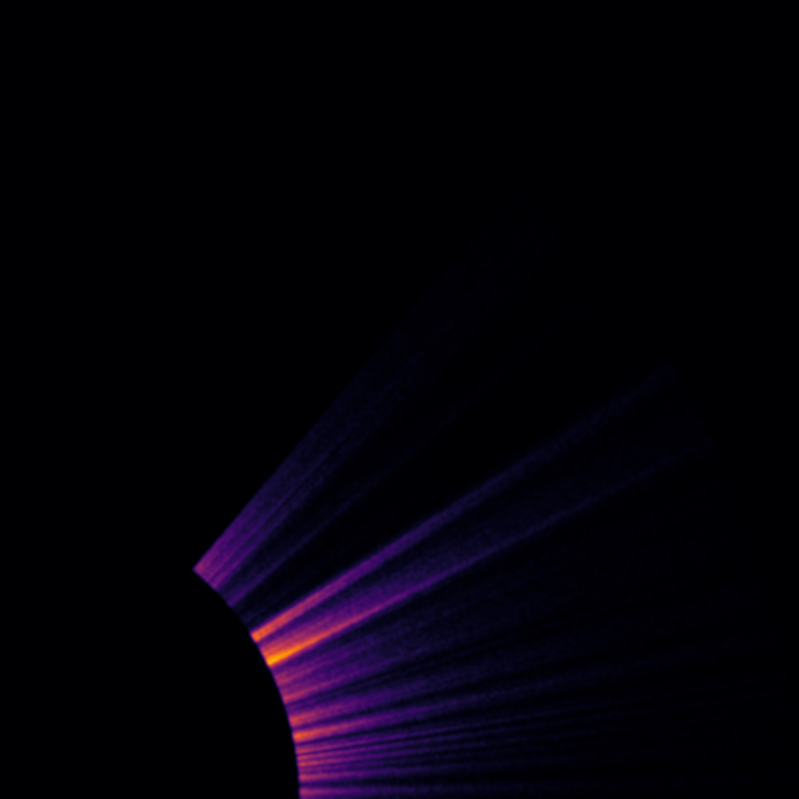
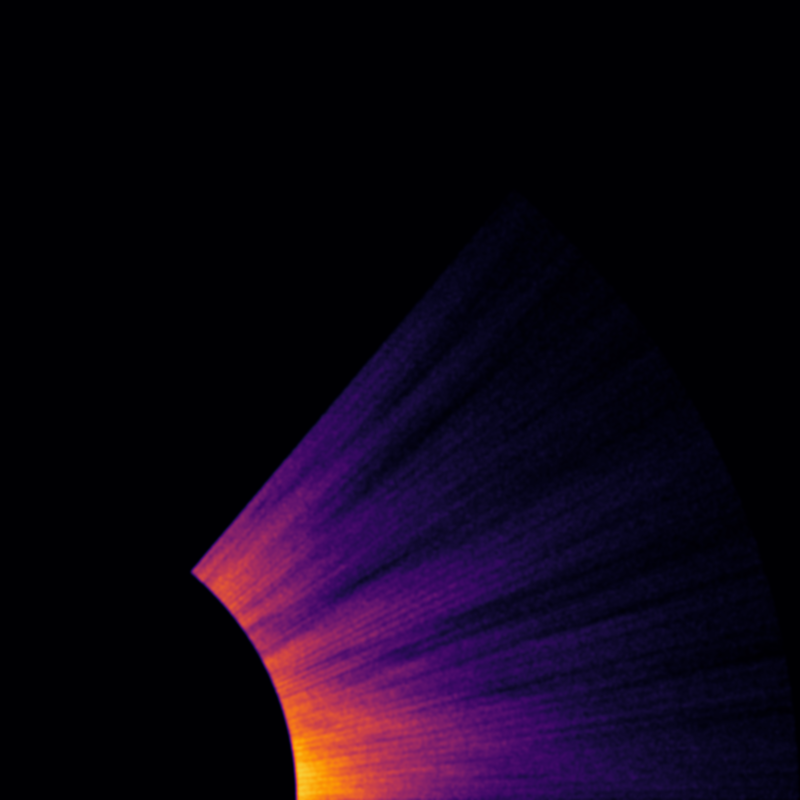
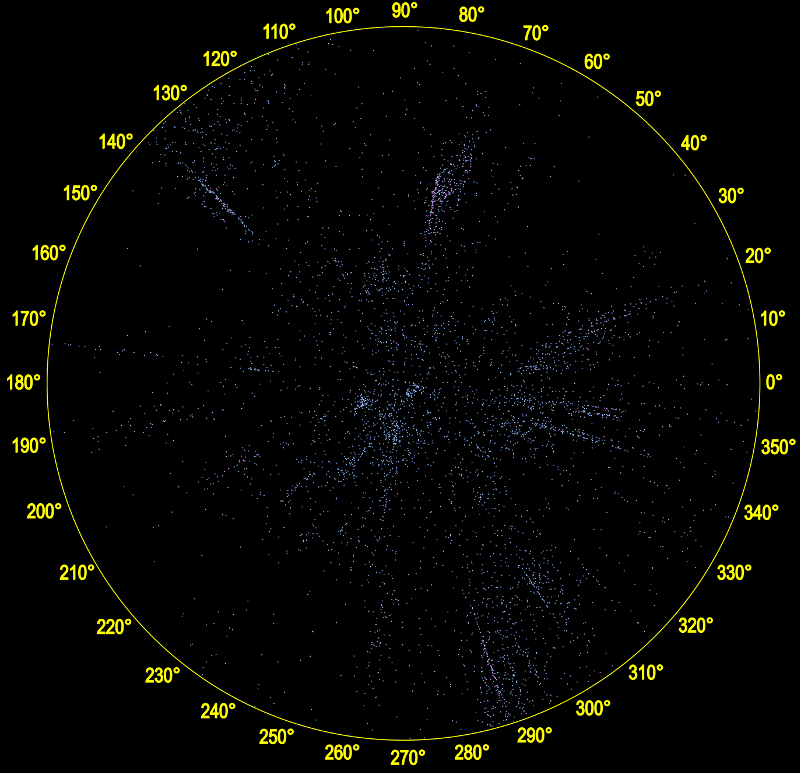
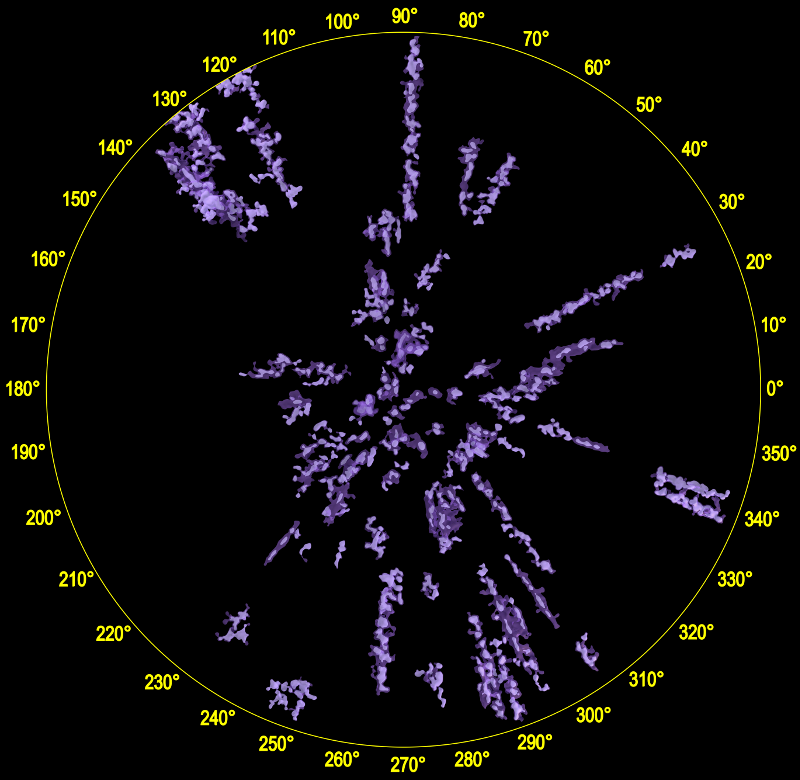
A technique called density isosurfaces is more commonly used to generate images from medical MRI scans.

In this technique we generate 3D surfaces consisting of a common density value, much like we can use contour lines on topographic maps to show regions of common elevation. In MRI scans this is human tissue density. For galaxy mapping we can use star density, counting the number of stars per cubic parsec. We can, in a way, use Gaia data to do an MRI scan of the Milky Way.

There is a crucial point about stars that affects mapping using this density technique.

This is that older cooler stars cannot be seen from a great distance, and tend to move around randomly from their place of birth. A random starscape does not give anything interesting to map.

So if you are going to make a large map, it often works better to focus on younger, hotter stars. These are usually closer to their birth places and can be seen for a long distance. And if you are going to make a smaller map, you can include cooler stars as well, but best to focus on large dense clumps as these will be closer to their birth places than a less dense random haze.

There is one major barrier to implementing this plan for larger maps, and that is dust. Dust can obscure and redden young hot stars and make them appear to be older cooler stars instead.

There was an attempt to provide information about reddening in the Gaia DR2 release, but it is not accurate enough for mapping. This is likely to be improved in future Gaia releases.

For this reason, astronomers have prepared special dereddened hot star subsets of the Gaia data set by adding additional information from other surveys. It turns out that infrared data is especially valuable in determining a star's true nature because infrared radiation is less affected by dust.

The hot star data sources

The Galaxy Map hot star density maps are derived from three star databases. The first is a set of about 600 thousand Gaia stars that have been dereddened using the 2MASS infrared survey. This data set is described in this paper:

Poggio, E., R. Drimmel, M. G. Lattanzi, R. L. Smart, A. Spagna, R. Andrae, C. A. L. Bailer-Jones et al. "The Galactic warp revealed by Gaia DR2 kinematics" Monthly Notices of the Royal Astronomical Society: Letters 481, no. 1 (2018): L21-L25.

(Thank you to Eloisa Poggio for providing the latest version of this data set on 30 August 2019.)

This was merged with a second StarHorse data set with an additional 200 thousand hot stars with (BPRP0 < -0.1) and (SH_GAIAFLAG == '000') and (SH_OUTFLAG == '00000') from:

Anders, Friedrich, et al. "Photo-astrometric distances, extinctions, and astrophysical parameters for Gaia DR2 stars brighter than G= 18." Astronomy & Astrophysics 628 (2019): A94.

Both these hot star data sets are missing stars close to the Sun. So they are supplemented with a database of about 10 thousand OB stars within 1 kpc using SIMBAD colours and Bailer-Jones distances derived from Gaia DR2.

Other star data sources

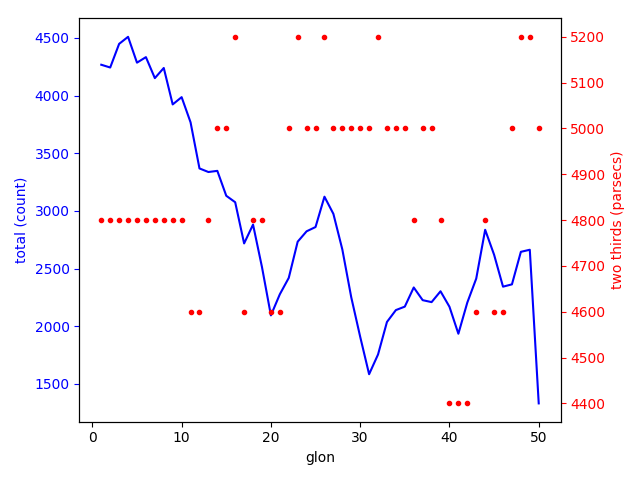
Star clumps with no temperature or colour limits are computed using Bailer-Jones distances for older maps. Recent maps use a zero point correction of -0.029 and the formula: distance in parallax = 1000/(plx-zero_point_correction) .

OB associations

OB association positions were computed from the median distance to the member stars given in the data set first described in:

Humphreys, R. M. "Studies of luminous stars in nearby galaxies. I. Supergiants and O stars in the Milky Way" Astrophysical Journal, Suppl. Ser., Vol. 38, p. 309 - 350.

HII regions

HII region positions were computed from the distance to known ionizing open clusters or using the median distance to known ionizing stars.

Star clusters

The newest maps use the Gaia DR2 open cluster catalog described in:

Cantat-Gaudin, T., et al. "Painting a portrait of the Galactic disc with its stellar clusters." arXiv preprint arXiv:2004.07274 (2020).

We calculate the cluster distances using the cluster parallax and a zero point correction of -0.029. distance in parallax = 1000/(plx-zero_point_correction)

We use this calculation rather than the distances provided in the 2020 open cluster catalog because it ensures that the clusters align with the Gaia density clumps.

For older maps:

The main data set for the star clusters was kindly provided by Tristan Cantat-Gaudin on 10 December 2019 and is described in this paper:

Cantat-Gaudin, T., and F. Anders. "Clusters and mirages: cataloguing stellar aggregates in the Milky Way." Astronomy & Astrophysics 633 (2020): A99.

This was supplemented by the new cluster data set described in:

Liu, Lei, and Xiaoying Pang. "A catalog of newly identified star clusters in GAIA DR2." The Astrophysical Journal Supplement Series 245.2 (2019): 32.

I removed some Liu Pang clusters that clearly duplicated Cantat-Gaudin clusters.

And also supplemented by the new clusters contained in this paper:

Castro-Ginard, A., et al. "Hunting for open clusters in Gaia DR2: 582 new open clusters in the Galactic disc." Astronomy & Astrophysics 635 (2020): A45.

Dust

Rosine Lallement has led a team that has published several important papers on dust distribution derived from the Gaia data. The most recent dust data set is used on our maps and is described in:

Lallement, R., et al. "Gaia-2MASS 3D maps of Galactic interstellar dust within 3 kpc." Astronomy & Astrophysics 625 (2019): A135.

Molecular Clouds

Many of the dust cloud labels are derived from the molecular cloud maps contained in:

Zucker, Catherine, et al. "A compendium of distances to molecular clouds in the Star Formation Handbook." Astronomy & Astrophysics 633 (2020): A51.

Luminous stars

Several of the maps contain overlays of luminous stars. These are determined by taking Gaia DR2 stars with low astrometry errors (err/plx< 0.2, G > 5 and RUWE < 1.4). If these stars are in the 2MASS and StarHorse catalogs and the StarHorse quality flags are (SH_GAIAFLAG == '000') and (SH_OUTFLAG == '00000') and the 2MASS quality flag is 'AAA', then we use the StarHorse dereddened absolute magnitude, otherwise we calculate the absolute magnitude using Gaia G and the parallax with a zero point correction of -0.029. We've also supplemented this data set with Hipparcos 2007 re-analysis stars with err/plx < 0.2 if they are not in our list.

We filter out Gaia stars with G < 5 because Gaia stars with very high relative magnitude are known to have unreliable parallaxes, as described in this research note:

https://iopscience.iop.org/article/10.3847/2515-5172/ab2632

You can download a list of about 38 thousand luminous stars with absolute magnitude < -2 and distances within 3 kpc here:

http://gruze.org/galaxymap/luminous/all_3kpc_luminous_merged.zip

Tools

MeshLab, Blender and Inkscape, plus many (many) Python scripts.

Acknowledgements

Star density mapping was pioneered for the Hipparcos data set and inspired the Galaxy Map initiatives. These results are described in the paper:

Bouy, H., and J. Alves. "Cosmography of OB stars in the solar neighbourhood." Astronomy & Astrophysics 584 (2015): A26.

Some recent maps of the solar neighbourhood appear in:

Zari, E., et al. "3D mapping of young stars in the solar neighbourhood with Gaia DR2." Astronomy & Astrophysics 620 (2018): A172.

This work has made use of data from the European Space Agency (ESA) mission Gaia (http://www.cosmos.esa.int/gaia), processed by the Gaia Data Processing and Analysis Consortium (DPAC, http://www.cosmos.esa.int/web/gaia/dpac/consortium).

Funding for the DPAC has been provided by national institutions, in particular the institutions participating in the Gaia Multilateral Agreement.

This research has made use of the SIMBAD database, operated at CDS, Strasbourg, France.

Many members of the Gaia team have provided useful advice and aid but in particular I would like to thank Anthony Brown for strongly encouraging this project and Ronald Drimmel for providing invaluable data and technical advice. I would also like to thank Stefan Payne-Wardenaar for help with Blender materials.

Can we detect the galactic bar using Gaia DR2?

Submitted by Kevin Jardine on 14 February, 2019 - 16:07

The galactic bar is located in the inner galaxy at a large distance from the Sun. Its closest approach lies in the heavily dust obscured first quadrant. Nevertheless, can we detect the bar using the Gaia DR2 data set? I think that the answer is yes if we are willing to map it using quantitative star counts and do not expect a great deal of detail.

Here's the region in the first quadrant that we want to map:

What helps is that the bar extends far above and below the galactic plane and ends in a point. That creates a geometry that can be detected despite all the data limitations.

If we just try to map the bar in the galactic plane, we do not get an encouraging result because of all the dust extinction:

This is a density map of stars between 0 and 50 degrees in galactic longitude and between 3 and 8 kpc. (The parallax errors are so high at this distance that I did not impose any error constraints on the stars except RUWE < 1.4)

However, if we look 400 parsecs below the galactic plane, we can avoid the extinction but now the parallax errors are so high that much of the detail is blurred out:

What I think helps is a more quantitative approach using star counts. Here's a graph that analyzes the star counts and distribution, also for a slice taken 400 parsecs below the galactic plane:

The x axis shows the galactic longitude. The blue data and left y axis shows the total Gaia star count between 3 and 8 kpc for that degree longitude at 400 parsecs below the graphics plane. The red dots and right y axis shows how far you need to go in distance beyond 3 kpc to find two-thirds of the stars for that degree longitude.

What you find is that we start with about 4500 stars close to zero degrees longitude and that as we approach 20 degrees the star count drops and so does the distance required to find two-thirds of the stars. What this says to me is that from 0 to 20 degrees the stars are in a structure that starts wide and gradually narrows to a point - just what you would expect from a bar shaped structure.

I've tried numerous slices and I see the same pattern with the point (end of the bar) occurring around 20 degrees from 400 parsecs below the galactic plane and beyond, as well as about 25-30 degrees from 400 parsecs above the galactic plane and beyond. Larger than about 20-25 degrees we see a pattern that is not so clear but arguably could be two spiral arms passing at different distances from the end of the bar below the galactic plane and one spiral arm above the galactic plane (the arm that passes closest to the end of the bar runs entirely below the galactic plane).

So in short, in the region close to the bar, we seem to see a spiral arm (the Centaurus arm) intersect the bar close to and beneath the tip.

Within 400 parsecs of the galactic plane, the pattern becomes more chaotic, probably because of dust extinction.

Searching the galaxy map

Submitted by Kevin Jardine on 10 July, 2018 - 00:16
Galaxy map search interface
The latest version of the galaxy map supports searching for stars and displaying their locations.

The new version of the galaxy map, (http://galaxymap.org/dr2) released today, supports searching for stars. You can enter any Gaia DR2 source identifier or Simbad identifier in the search box at the upper right and if the object has a parallax, its position will be shown on the map. The most probable location will be shown with a green cross hair and other possible locations are shown along a light blue line. If Simbad has more information on the object, some of it will be shown in a pop up box, including common names, coordinates, z height, spectrum and absolute magnitude.

Because Simbad includes all the Hipparcos parallaxes, it is possible to search for Hipparcos stars even if they are too bright to appear in Gaia DR2. Simbad identifiers include common names so, for example, you can search for "Betelgeuse".

By default, the Bailer-Jones et.al. distance catalog is used to determine Gaia DR2 distances. You can turn off Bailer-Jones distances to use the simple reciprocal calculation instead (only available when err/plx < 0.2) by unticking the Bailer-Jones distances box..

Currently the Bailer-Jones catalog is only available through the Heidelberg ARI TAP service which does not include the CORS headers that allow queries to be accessed via JavaScript applications. To solve this I am using a sneaky trick involving a NodeJS proxy running on my own server that accesses the Heidelberg service. I hope that remains stable until the Bailer-Jones catalog is available via Vizier (or the TAP service adds the appropriate headers to support client applications).

In addition to search, I've added a display of longitude and galactic plane distance at the bottom left corner that tracks your mouse pointer (not available for mobile devices).

Making a galaxy map, Part 6: Resources

Submitted by Kevin Jardine on 26 June, 2018 - 09:41
Galaxy map meshes in Gaia Sky
Gaia Sky comes with most of the mesh sets preinstalled.

Here are some resources for the galaxy map.

Software

Python scripts for creating and selecting the meshes:

https://github.com/kevinjardine/gaiadr2

Gaia Sky key frame animator:

https://github.com/kevinjardine/gaiasky_contrib

Meshes

All map meshes set up in Blender with lighting and materials:

http://gruze.org/galaxymap/resources/dr2_ob_release_blender.zip

Gaia Sky meshes:

https://zah.uni-heidelberg.de/institutes/ari/gaia/outreach/gaiasky/downloads/#isosurfaces

All but the two largest mesh sets (Non ionizing ranges ge25 lt50 and Non ionizing peaks ge25 lt50) are part of the normal Gaia Sky install.

Individual map meshes:

http://gruze.org/galaxymap/resources/map_meshes.zip

These are for use outside of Gaia Sky and are larger more detailed versions. As the hot star, dust and HII region meshes were created using different bin sizes and orientations, it probably makes sense to convert them to a standard coordinate system representing parsecs where the galactic centre (0 degrees) is to the right and the sun is at (0,0,0).

Here are the transformations:

hot star meshes: multiply mesh coordinates by 3, translate by (-3027,-2997,-597), rotate by -90 degrees
dust meshes: multiply mesh coordinates by 5, translate by (-2045,-1995,-300), rotate by -90 degrees
HII regions: no transformation should be necessary.

Mesh used for hot star 3D print:

http://gruze.org/galaxymap/resources/iso_5_percent_solid_scaled_fixed.obj.zip

Mesh used for all star 3D print:

http://gruze.org/galaxymap/resources/all_mesh_region_5-23_scaled.obj.zip

Poster

SVG source and background images:

http://gruze.org/galaxymap/resources/poster.zip

Star lists

Ionizing stars

http://gruze.org/galaxymap/resources/star_lists.zip

Making a galaxy map, Part 5: Overlays

Submitted by Kevin Jardine on 22 June, 2018 - 00:22
Galaxy map with
Galaxy map with three mesh sets: very ionizing, some ionizing, and no ionizing with 50 or more stars.

Over the last few blog posts I've outlined the process I used to create a hot star map of the galaxy within 3000 pc. Along the way I mentioned many different choices I made for the map, from star filtering, to density calculations, to mesh selections.

How can we tell that these choices were appropriate and actually created the map I desired?

Answering this question is made more difficult by the revolutionary nature of the Gaia DR2 data set. There has never been a data set large enough and accurate enough to make a map of the galaxy beyond about 300 parsecs before. Gaia DR2 allows a map with a radius that is an order of magnitude larger. There are no other maps for comparison.

There is, fortunately, a very relevant and highly studied set of stars that we can use as a check on the map: the list of known ionizing stars, which is included as an overlay on the map. These extremely hot stars, either Wolf-Rayet stars or stars of class O-B3, emit intense ultraviolet radiation, ionizing any nearby hydrogen clouds by ripping electrons apart from protons, and producing red glowing HII regions visible for thousand of parsecs.

These ionizing stars, and the HII regions they create, are an obvious spiral arm marker in other galaxies, and creating lists of these stars in the Milky Way has been an important project for astronomers interested in mapping our home galaxy.

Roberta Humphreys first published a large list of highly luminous stars, including many ionizing stars, in her highly cited 1978 paper, Studies of luminous stars in nearby galaxies. I. Supergiants and O stars in the Milky Way [ADS link: 1978ApJS...38..309H] It was subsequently expanded by Douglas McElroy and Cindy Blaha and released in 1984. The catalog and a SIMBAD cross match is available from my blog post here.

More recently, researchers have created extensive catalogs of O stars and Wolf-Rayet stars.

Astronomers have also published lists of ionizing stars for individual HII regions. I have compiled these results into a list of more than 700 stars as described in this blog post.

Wright et. al., "The massive star population of Cygnus OB2", Mon. Not. R. Astron. Soc. 449, 741 (2015) have a list of ionizing stars in Vizier.

Finally, almost all of the 340 thousand stars I used to create the map have 2MASS cross matches. About half of these 2MASS identifiers have entries in the SIMBAD astronomical database. I downloaded the basic data for these stars and selected the stars with ionizing spectral types.

After combining all these lists and cross matching with the Gaia DR2 catalog using the 2MASS, Tycho-2 and UCAC4 cross match lists, I ended up with a list of more than 6000 ionizing stars. (I'll include this list in my resource post next week.)

I used the distance estimates from C.A.L. Bailer-Jones et. al. in "Estimating distances from parallaxes IV: Distances to 1.33 billion stars in Gaia Data Release 2" to place the stars on the map. About 5000 of the stars were within 3000 parsecs.

Here are the stars below:

and here is the map with just the very ionizing mesh set:

You can do a more detailed comparison by toggling on and off the ionizing stars on the interactive map site.

I conclude from this comparison that the map includes almost all the regions with known ionizing stars (the main exception in the above image being the highly reddened Cyg OB2 region, which shows up only in the cooler meshes). However the "very ionizing meshes" (which are selected using Gaia DR2 colours) also include a few regions that have few ionizing stars in my list. In a future blog post, I'll look more carefully at these "extra" regions. It will be interesting to see what happens to the map with Gaia DR3, currently expected in late 2020, which should have more accurate photometry.

It is also interesting to compare my map with the recently released preprint on star clusters in Gaia DR2:
Cantat-Gaudin, T. et. al., "A Gaia DR2 view of the Open Cluster population in the Milky Way". Unfortunately the electronic data mentioned in that paper does not seem to have been released yet (or at least I cannot find it) so I'll have to resort to some ugly image scraping from the paper. I'll replace this with a proper map when I can get the data:

The blue and purple clusters are the youngest clusters. The yellow clusters are cooler clusters more than a billion years old so are not relevant for my hot star map.

All of these maps are consistent with three basic patterns for the ionizing stars within 3000 parsecs:

  • The ionizing stars in the Perseus arm are concentrated in the Cassiopeia region between 115-140°. The ionizing stars in the third quadrant (180-270°) are not very concentrated except perhaps in the Vela molecular ridge.
  • The Sagittarius arm is visible in the fourth quadrant (270-360°), especially in the Carina region and to a weaker extent in the first quadrant (0-90°)
  • The Orion spur is visible as an extended diagonal slash between the Perseus and Sagittarius arms.

The full face-on map here also includes two additional features derived from subsets of the ionizing star list: HII regions are positioned on the map as described in this blog post and OB association labels are determined from the median distance to the star members as given in the 1984 Humphreys catalog, with the exception of the Cyg OB7 label, which I moved closer to the position of the Sh 2-117 HII region. The Cyg OB7 stars as listed in the Humphreys catalog were very widely distributed in Gaia DR2, leaving no clear position, but Cyg OB7 is often associated with this HII region, which includes the Pelican and North America nebulae.

There were also a small number of OB association labels from the Humphreys list that were positioned near no obvious star concentration or isosurface region (such as R 103 and R 105) and I removed those from the map. You can see these in the pdf linked from this blog post.

Finally, the full map includes dust concentrations within 2000 parsecs using the data cube provided at the download link on this page:

http://stilism.obspm.fr/about

which is described in this preprint:

"3D maps of interstellar dust in the Local Arm: using Gaia, 2MASS and APOGEE-DR14" by Lallement et al.

Next week, in the last blog post in this series, I'll provide links to star lists, meshes, source code and other resources for the galaxy map.

Pages

Subscribe to RSS - blogs