When astronomers examine the Milky Way galaxy, they are like the blind people examining the elephant in the old folk tale.
Just as each person in the story examined only one part of the elephant, so astronomers must work from limited information. Often arguments about whether the Milky Way has two, three, four or even five major spiral arms depend upon whether one is looking at radio or infrared frequencies, examining cold hydrogen gas or hot young stars, or building models using strict logarithmic spirals or more complex structures.
For this reason, the two main data collections on this site, the Milky Way Explorer and the Velocity Explorer, try to combine data from many different sources.
For the past few years, I have put a lot of effort into expanding the range of electromagnetic frequencies available through the Milky Way Explorer, from gamma rays and x-rays, visible light, infrared, millimeter waves and radio. Each frequency adds more detail to a complex picture.
However, frequency data alone is projected on a two-dimensional sphere, and cannot by itself help us build a full three dimensional map of the Milky Way. For this reason I have added a completely different approach, the Velocity Explorer, which maps the velocity of hydrogen and molecular gas and provides clues to the full three dimensional structure of the galaxy as explained in the section on Velocity.
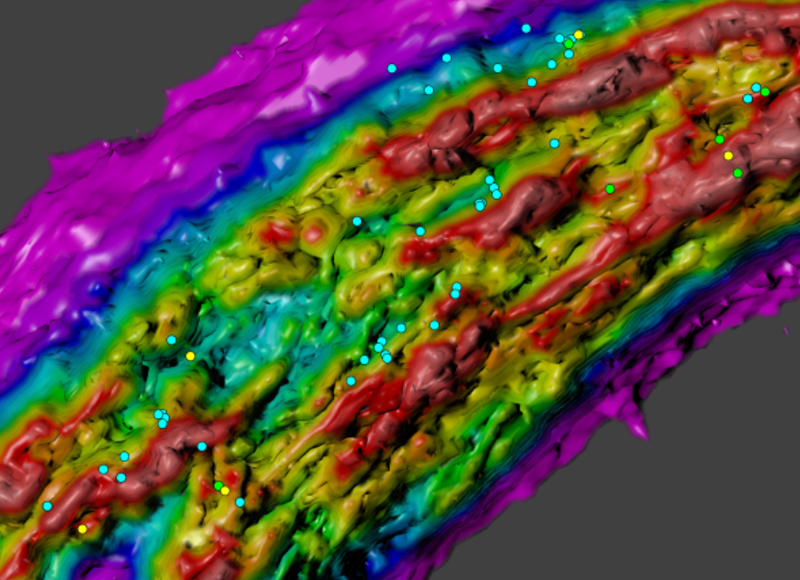
Today I introduced a major new feature to the Velocity Explorer - two new images which overlay velocity data from three recent catalogs of objects that trace spiral structure, including young stars, masers and HII regions. By and large (but not always!) the velocity of these denser objects is consistent with the velocity of the atomic hydrogen and molecular gas.
To make a comparison with terrestrial cartography, the gas clouds are the broad continental boundaries, whereas the new velocity data shows star formation regions that are like the major population centres. If we mapped the Earth by only including large cities, we would miss large parts of Canada, Russia and Australia (not to mention the entire continent of Antarctica!). Conversely, if we left out the cities, we would leave out much that is of interest to human beings.

You can plunge right into the new overlay images in atomic hydrogen and molecular gas but you will need to read the introduction to the Velocity Explorer and perhaps the whole section on this site on mapping hydrogen gas to get some context.
Here are the sources for the coloured dots that appear as an overlay on the new images:
