You are here

Blogs

More on Herschel

Submitted by Kevin Jardine on 15 May, 2009 - 08:07

Just as a follow-on to my last post, the preliminary science program for Herschel is here:

http://herschel.esac.esa.int/Key_Programmes.shtml

and the only large mapping project I can see is this one:

https://hi-gal.ifsi-roma.inaf.it/higal/

which basically redoes the Spitzer inner galaxy survey but in more detail and with a larger range of frequencies.

That will be exciting when finished (probably in a couple of years).

I do hope that more large surveys are added. For example, it would be fantastic to have a larger survey of the Cygnus region beyond the more focused one mentioned here:

http://starformation-herschel.iap.fr/hobys/cygnus.jpg

But perhaps that depends on how long the coolant holds out.

The king is dead - long live the king

Submitted by Kevin Jardine on 14 May, 2009 - 16:21

This has been an amazing week for those interested in space telescopes.

As I write this, the Hubble telescope has been lowered into a bay of the Shuttle Atlantis and is being re-equipped for another five-year mission. Seconds ago, the Herschel/Planck teams reported successful activation signals from those two observatories. And, more sadly, the Spitzer infrared telescope has finally run out of coolant after almost six years of wildly successful operation, reducing it to two frequencies from one instrument.

Although the two observatories are different in detail, the Herschel infrared telescope is the natural successor to Spitzer and it is an enormous relief to know (fingers crossed) that the Herschel mission is also on track for success. Herschel is by far the largest space telescope ever launched. As the Herschel website points out:

The telescope's primary mirror is 3.5 m in diameter, more than four times larger than any previous infrared space telescope and almost one and a half times larger than that of the Hubble Space Telescope. The telescope will collect almost twenty times more light than any previous infrared space telescope.

The infrared space telescopes (especially IRAS, MSX and Spitzer) have arguably been more important to mapping our Milky Way than any other scientific instrument. These instruments have been wildly successful in piercing through obscuring dust and giving us a view of our home galaxy that no telescope operating at optical frequencies could ever do.

I can only hope that Herschel will contribute much to this great tradition. This is already a bit of doubt unfortunately, ironically because of the power of the instrument. IRAS, MSX and Spitzer all made large surveys (respectively of the whole sky, the galactic plane, and the inner galaxy). Surveys are essential for mapping the Milky Way and discovering new objects. Because of Herschel's size, there may be a temptation to use it only for examining known objects more closely rather than doing larger surveys. Spitzer team member Barbara Whitney hinted at this when she said:

I suspect that Spitzer's view of the galaxy is the best that we'll have for the foreseeable future. There is currently no mission planned that has both a wide field of view and the sensitivity needed to probe the Milky Way at these infrared wavelengths.

Let's hope that Herschel's greater power does indeed allow it to make an even greater contribution to science than the infrared telescopes that have come before.

Sh 2-168 in IPHAS

Submitted by Kevin Jardine on 21 April, 2009 - 08:28

Over the last year, I've added a number of powerful tools for mapping the Milky Way to this site, including the Avedisova Catalog, the Milky Way Explorer, and the Commentary on the Galactic Plane.

Recently I've been expanding my illustrated guide to the Sharpless Catalog using information from these new tools. Sometimes, however, there just isn't enough information published in the scientific literature about some of these interesting objects and then at least a detailed image can point to some of the mysteries still to be resolved.

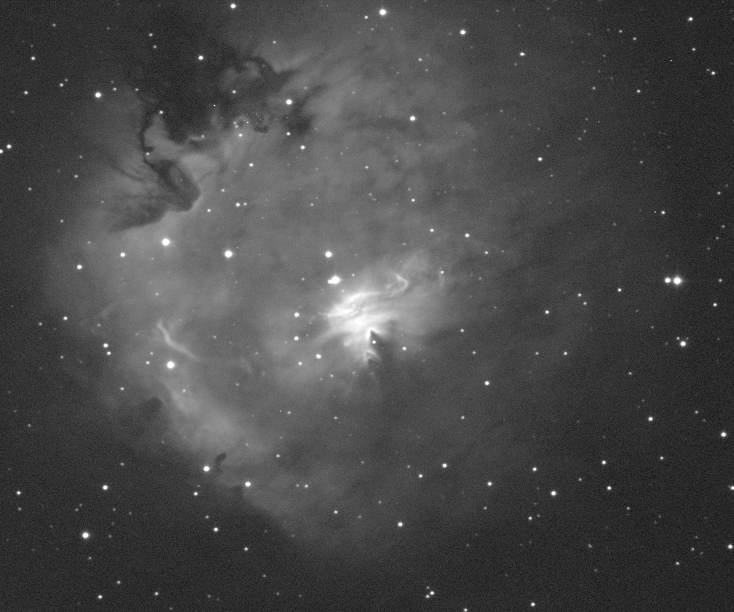
This is the case for Sh 2-168, a compact HII region that appears to be embedded in the expanding ring of gas and dust surrounding the Cas OB5 association in the Perseus arm. Below is an image created from the wonderful IPHAS hydrogen-alpha data using the procedure described here. (You can click on it for a larger version).

Avedisova concludes that this nebula is ionised by the O9 V star LS I +60 50. (SIMBAD reports a slightly cooler B0 V class.) Not surprisingly, this is the bright star near the central bright emission (just above the emission and slightly to the left). What I find interesting, however, are the objects visible in or near the disturbed area to the top left (northeast). At the edge of this region (and embedded in Sh 2-168) there seems to be a compact star cluster. I can't find a reference to this cluster in the scientific literature and perhaps it has never been closely examined. Bica and colleagues have reported a loose cluster visible in infrared in this nebula ([BDS2003] 47) and perhaps this compact grouping is part of that, but it doesn't seem to fit their description.

WorldWide Telescope experiment

Submitted by Kevin Jardine on 1 April, 2009 - 11:06

At the end of January, the WorldWide Telescope (WWT) team at Microsoft Research released tools to convert images into the WWT's native TOAST format.

I've used these tools to move seven of the Milky Way Explorer sky images into WWT, as well as an overlay view that identifies many of the objects visible in these images.

The link for this is at the end of this blog entry, but first some explanation.

In my initial review of the WorldWide Telescope I praised the basic software but criticised the limited survey data available for it. This has improved somewhat since then. In particular, the spectacular Spitzer infrared survey of the inner galaxy is now available through the WWT.

Nevertheless, many important surveys are still not available through the WWT, including the MSX infrared survey of the full galactic plane and many radio surveys.

The public WWT tools currently require the full image to be loaded into memory before it is TOASTed, preventing me from migrating larger surveys such as the full MSX A-band, which is currently available through the Milky Way Explorer. So for now I have created a low resolution version of this survey for the WWT.

I've also created a WWT version of the composite false-colour Effelsberg/Parkes radio survey of the galactic plane (described in the sources section of the description of the Milky Way Explorer) which reveals many interesting objects including supernova remnants not visible at other frequencies.

The WWT includes an IRAS infrared colour composite image. However, this image is very dark, which highlights bright objects in the galactic plane, but obscures infrared cirrus clouds elsewhere. I've created WWT versions of my "dark" and "bright" IRAS images, both of which are much brighter than the standard WWT image.

I've created WWT images of my false colour CO and hydrogen-alpha maps. Both of these data sets are already available through the WWT, but in a more limited colour range.

I've included my favourite image, which is a mountains-in-the-sky heightmap with the height determined by the Effelsberg/Parkes galactic plane radio intensity and the colour determined by the IRAS survey data.

The overlay image completes the set. This includes white ellipses showing the boundaries of OB associations, yellow circles showing the boundaries of ionising clusters, and pink, violet and blue balls showing, respectively, the locations of Wolf-Rayet, O-class and B-class ionising stars. Avedisova star formation regions are identified as yellow splotches, and supernova remnants as blue-green splotches. The sources for all this data are given in the Sources section of the description of the Milky Way Explorer.

By now I expect that you are impatiently waiting for the WTML link, but just a few more points before I give it:

  • Many of these surveys are for the galactic plane only and the WWT starts up elsewhere (Pisces, apparently, at least for me). So you may need to move your view to see anything.
  • I'm currently storing this data on my own server, which, unlike the Microsoft WWT server, is not a superfast system. So you may need to wait several minutes for the images to finish loading. Fortunately, they should be cached on your own hard drive during subsequent visits.
  • The WWT does not appear to have a marker system, or at least none that has been publicly announced that I am aware of. However, there is a hack that is almost as good if you don't mind editing one of the WWT files. In:

    C:\Documents and Settings\Your Username\Local Settings\Application Data\Microsoft\WorldWideTelescope\data\places

    find the file:

    Stars.xml

    Open this in a text editor, and after the line:

    <dataset name="Common Named Stars" Groups="State" type="place">

    add the line:

    <file name="Overlay Objects" url="http://socnet.bz/wtml/toast/overlay.txt" Browseable="False">Overlay Objects</file>

    This will add several thousand annotations for ionising stars, supernova remnants and Avedisova star formation regions to WWT and works well with the overlay view in particular.

  • One of the greatest strengths of the WWT is its ability to overlay foreground and background images. For example, you can set the Overlay to the foreground and use any other image (one of mine or another one) as the background. You can cross fade in between them. I find it especially interesting to cross fade in between the CO view that shows molecular clouds and the radio/IRAS heightmap image.
  • The MSX image is off by a few pixels, which is slightly noticeable if you cross fade it with another image. I'll fix that when I am able to TOAST the full MSX survey.

Without further ado, if you click on this WTML link, you should be able to view the data in WWT.

The end of the rainbow

Submitted by Kevin Jardine on 11 January, 2009 - 16:35

It turns out that the CfA radio study I mentioned a few days ago has not actually been released yet. There is so far only a press release and an abstract of the recent presentation at the AAS.

Mark Reid, the presenter and principal investigator, tells me that a preprint of the paper should be available "in a month or two". Reid, did point out, however, that 5 associated papers were already available as preprints. I've read through them and a number of related papers and find them mind-blowing.

What is revolutionary about the CfA approach is not just the results but how Reid and his team got them: parallax.

Parallax is the way that surveyors get their distance estimates. They measure the angle to an object from one location, and then from a second location. The change in the angle and a bit of basic trigonometry tells you the distance.

Astronomers have used (or tried to use) parallax for centuries. Tycho Brahe used parallax to argue that the supernova he observed in 1572 (which had no measurable parallax) must be as far as away as the other stars and was not a local object.

Measuring parallax for objects as far away as stars requires incredible accuracy, and the first stellar parallax measurement (of the nearby 61 Cygni) did not happen until the 19th century.

The results from the Hipparcos parallax-measuring satellite inspired the creation of this site and helped to map out in detail part of our local system of bright stars: the Gould Belt.

The Gould Belt is only our local stellar neighbourhood, however. To get distance estimates beyond this, in order to map out spiral arms, for example, astronomers do not have parallax measurements that are accurate enough and instead have had to use mathematical models of the galaxy that made guesses about the velocity of molecular clouds, or how much dust exists in different directions.

To be honest, these models are crude and the results obtained using them are dubious. Parallax is a much better method.

The next parallax-measuring satellite, Gaia, is scheduled to launch towards the end of 2011. Gaia should be able to get distance estimates to a billion stars and map out the Milky Way much more accurately.

Detailed results from Gaia might not be available for a decade or more, however, and even Gaia will not be able to observe large areas of the Milky Way blocked by clouds of dust.

This is why the CfA results are so amazing. Using computer wizardry, astronomers have succeeded in combining ten US radio telescopes into a single instrument - the Very Long Baseline Array (VLBA). If the VLBA were an optical telescope, it would be able to read a newspaper in Los Angeles from the distance of New York. As a network of radio telescopes, the VLBA can pierce through obscuring dust clouds.

According to a recent European paper co-authored by Reid, the VLBA and similar radio telescope networks should be able to measure parallax accurately enough to map out the Milky Way within 10 thousand parsecs, which is more than half of the visible galaxy!

Reid's first VLBA preprint sets out the agenda:

We are using the NRAO Very Long Baseline Array (VLBA) to determine trigonometric parallaxes of strong methanol maser sources, which are associated with regions of massive star formation and their attendant HII regions. Sampling spiral arms roughly every kpc should determine the true locations of arms, and allow us to use other databases to “interpolate” between the star forming regions measured with masers. With accurate distances to some of the largest star forming regions, we should be able to verify the existence and determine the locations of the postulated Perseus, Carina–Sagittarius, Crux–Scutum, and Norma spiral arms.

Besides the VLBA, a second radio telescope network, EVN, has been set up that combines radio telescopes in Europe, Asia and South Africa.

It seems that over the next decade, and possibly much sooner, the dream of this website and of many people interested in astronomy will finally be achieved: a detailed and accurate map of much of the Milky Way.

Pages

Subscribe to RSS - blogs