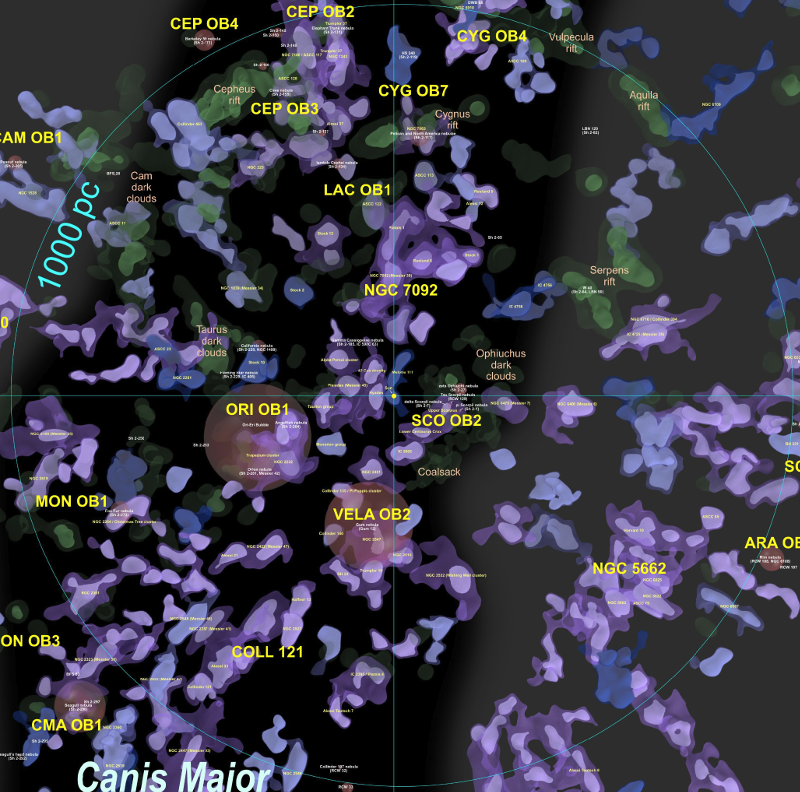
A detail from the face-on map of the Milky Way. The full map poster is is available on the web here.
Sometimes dreams do come true. Today I can announce a detailed map of the Milky Way out to 3000 parsecs or about 10 thousand light years from the Sun.
I developed this map with help from scientists with the European Space Agency's Gaia mission and researchers at Leiden and Heidelberg universities. It includes star density isosurfaces mapping the major concentrations of the hotter O, B and A class stars in the Gaia DR2 release, about 5000 extremely hot ionizing stars, dust clouds and HII regions. Even better, it is available both in a face-on form viewed from above the Milky Way and in a true 3D version in the latest version of Gaia Sky.
A more detailed description of the map is up at the ESA Gaia mission website here.
A printable pdf is available here. (Warning, even at A0 size, the smallest labels are tiny. Needs sharp eyes, a magnifying glass or printing at a custom size with a width greater than one metre.)
A zoomable pannable web version is available here.
There is a gray background in the face-on versions of the map that shows the approximate locations of the inner and outer galaxy.
You can download the latest version of Gaia Sky with 3D mesh support here.
A Youtube trailer showing a flight through the map, animated in Gaia Sky, is available here:
Many people have helped make this map possible. I'd like to mention a few now.
Anthony Brown, a professor at Leiden University and the chair of Gaia's Data Processing and Analysis Consortium (DPAC), has been an enthusiastic supporter of this project and was always available with suggestions and comments.
Toni Sagristà Sellés, the principal developer of Gaia Sky, added numerous features to Gaia Sky to support visualizing and animating the 3D meshes.
Stefan Jordan, a professor at Heidelberg University, the sponsor of Gaia Sky, and Manager for Outreach and Education for DPAC, has also provided support and encouragement.
And at the European Space Agency itself, Jos de Bruijne and Tineke Roegiers, two Gaia Mission scientists, provided advice and support at key points in this project.
Finally, I'd like to thank Bob Benjamin, professor at the University of Wisconsin - Whitewater, who has long encouraged my interest in galactic cartography and made useful suggestions for positioning the HII regions on the current map.
The map depends upon data from many researchers. Here are some key credits:
Gaia Data Release 2 data as available from the Gaia Archive.
The isosurface technique was first pioneered for Hipparcos by H. Bouy and J. Alves, as explained in "Cosmography of OB stars in the Solar neighbourhood".
The map also includes dust density isosurfaces computed by dust extinction values provided in a preprint article "3D maps of interstellar dust in the Local Arm: using Gaia, 2MASS and APOGEE-DR14" by Lallement et al.
Positions for OB associations are based on the computed median distances to their members in the data set as described by R.M. Humphreys and D.B. McElroy in "The initial mass function for massive stars in the Galaxy and the Magellanic Clouds".
Positions for HII regions are computed using the median distances for known ionizing stars as described here.
The map also includes an overlay of about 5000 known ionizing stars. Distances for these stars are derived from a catalogue associated with a preprint article by C.A.L. Bailer-Jones et al in "Estimating distances from parallaxes IV: Distances to 1.33 billion stars in Gaia Data Release 2".
Of course all errors are mine. As with any map in the early days of exploration, it is bound to have missing sections and regions with incorrect data. But I think that it is a good start. I'm excited about the current map and even more looking forward to the many new features and improvements that we'll be adding in the future.
I've been running this site for almost 14 years now but today feels like a new beginning.
