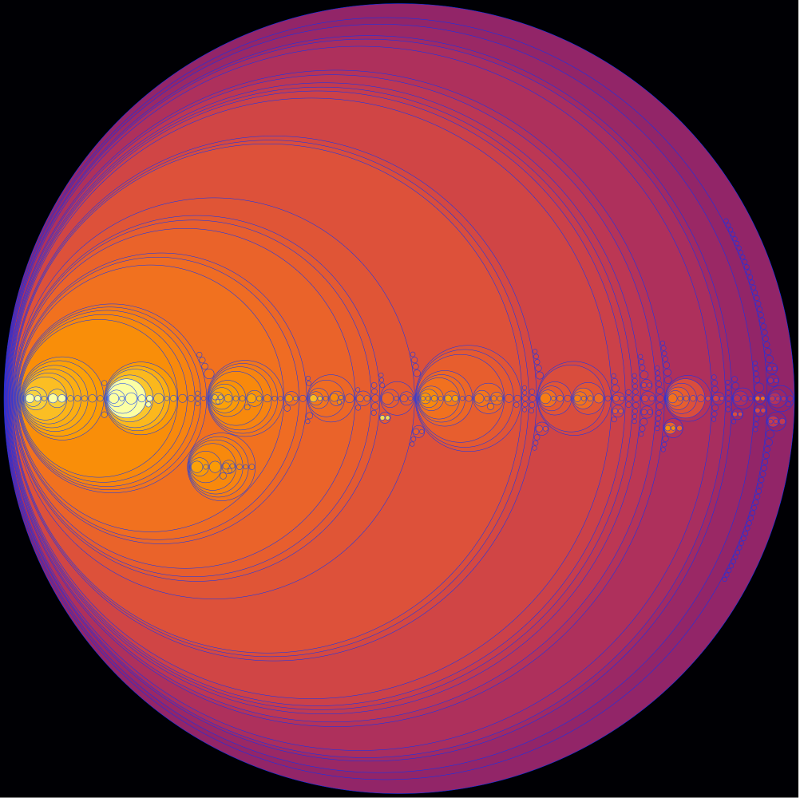
An enclosure diagram showing the 419 OB star density peaks with 5 or more stars in the solar neighbourhood (within 650 pc or 2100 ly).
Sometimes less is more. The above image is an enclosure diagram showing the star density peaks in the solar neighbourhood and how they are contained within each other.
It was constructed by computing the OB star density isosurfaces for each integer value from 10% to 99% and maintaining a list of stars contained by each connected subregion.
An enclosure diagram lacks position or shape data, but reveals the star distribution and structure in a clear way. The circle size represents the number of stars in the region and the colour intensity the density.
Using the large version of the enclosure diagram here you can hover over each component to see its region label, name, and the number of stars it contains.
The names are based on clusters, associations or the brightest star contained by the region.
You can see that the solar neighbourhood contains four major dense OB star concentrations: Scorpius OB2, Vela OB2, the Orion Belt (Orion OB1) and the Perseus / Taurus dark cloud concentration that includes the Pleiades and the Perseus OB3 association. Less dense but still large concentrations include the three northern regions (ASCC 123, Cepheus OB6, and the Sulafat highway) as well as the Wishing Well region named after its core Wishing Well cluster (NGC 3532).
In April 2018, Gaia DR2 will be released with distances to more than a billion stars. Density isosurfaces and enclosure diagrams will have key roles to play in mapping this dataset and identifying the major regions within it.
