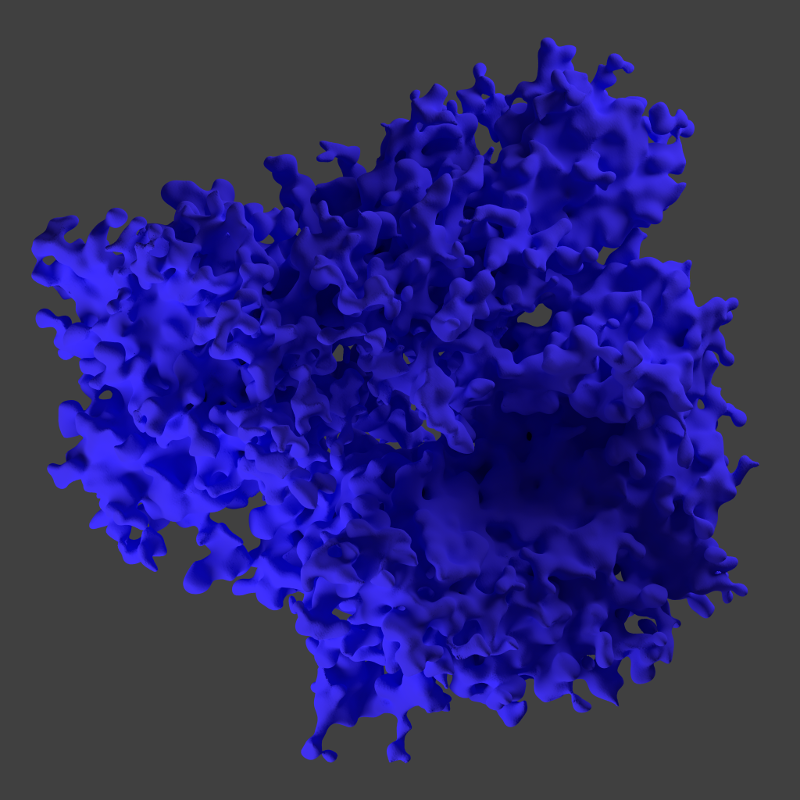
In my last blog post, I introduced Panurania, the stellar "supercontinent" that contains most of the high temperature stars in the solar neighbourhood. The above image is an isosurface of a temperature density function (25% of the maximum) derived from the hot stars (colour index < 0) in the Tycho-Gaia Astrometric Solution (TGAS) data set from Gaia DR1.
Clicking on the above image (which has galactic longitude 0° at the top) will bring you to a much more detailed zoomable graphic with a distance and galactic longitude display. Our sun is located at the centre of the image, well inside the Panurania structure.
(As always, it is important to keep in mind that I am using the limited TGAS data set, which starts to fade out about 600 pc from the Sun and has significant gaps even within that distance. Gaia DR2, expected about a year from now, should have more detailed data extending to a much larger distance. I'll be preparing revised maps when that becomes available.)
The most prominent feature in Panurania is a crater-like structure at the lower right. You can see an animation of Panurania showing the camera moving from above to below this region in this Youtube video:
(This video is displayed at only 2 frames per second - I'll upload a smoother animation when I get more rendering time.)
Although it is exciting to think that this might be a real structure, in fact it is known that TGAS is missing a lot of data from the upper third quadrant and this is likely a void in the data rather than a vast crater in the interstellar medium.
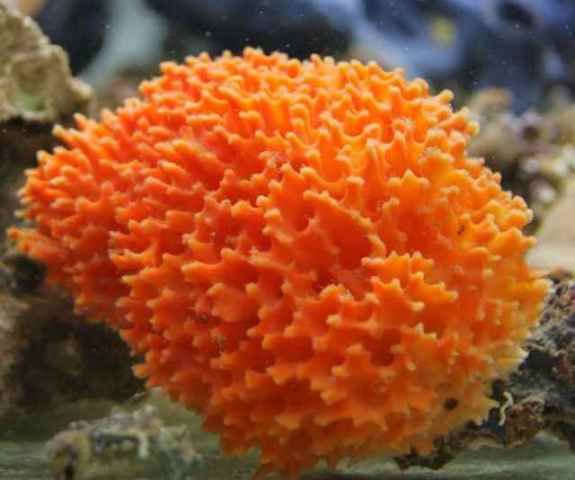
 The overall shape of Panurania, with its branches and ridges, is strikingly similar to a Red Ridge sponge (one species of which I believe is the Caribbean reef sponge Axinella corrugata).
That is worth repeating:
We are all living inside a gigantic sponge.
I'll be asking some astrophysicists about why Panurania resembles a sponge. One possible explanation is the way hot stars form out of collapsing filaments inside giant molecular clouds. See, for example, this recent blog post from Nick Wright.
Of course the image at the top of this blog post is not a full map. A full map would need labels and many overlays (prominent star clusters, dust clouds, supernova remnants, and so on).
That will evolve on this site over time. In my next blog post, I'll look at the three denser stellar continents that lie within Panurania.

