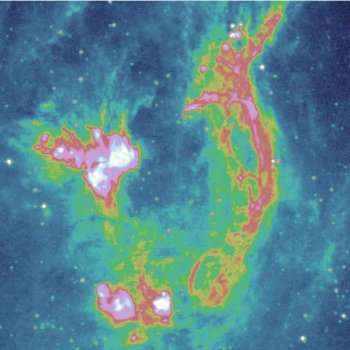
The Prawn Nebula (RCW 116, Gum 56), a part of the Sco OB1 association, in infrared at full MSX resolution.
The Galactic Plane Explorer is now outdated. It has been replaced by the Milky Way Explorer which contains more information and is even easier to use!
You can find the Galactic Plane Explorer here, but please read this introduction carefully before using it.
Seeing through the dust
Perhaps the most difficult problem in mapping the Milky Way galaxy is that our view of much of it is blocked by large clouds of dust. As a result, the standard lists of visible nebulae and intensely luminous stars are sadly incomplete.
The Galactic Plane Explorer is intended to help solve this problem by combining images and data from outside the visual spectrum to produce a new view of our home galaxy. These non-visual frequencies are transmitted through the Milky Way's dust clouds and enable us to see what lies beyond them.
Major data sets
The two major data sets used to produce the Galactic Plane Explorer deserve to be better known outside professional astronomy circles. These are the comprehensive MSX infrared images of the galactic plane, available from NASA's Infrared Science Archive, and the Catalog of Star-Forming Regions in the Galaxy, produced by Veta Avedisova and her colleagues at the Centre for Astronomical Data in Moscow. The full sources of the data used to create the Explorer are described in the Sources section at the bottom of this page.
The MSX data are currently the most detailed complete images of the galactic plane available outside the visual spectrum. The Avedisova catalog is the most comprehensive list of star forming regions (including regions not detectable in visual light) with 3229 major regions, and a total of 66885 observations referenced.
The two data sets work well together, with the Avedisova catalog forming a guide to many of the major objects visible in the MSX images.
In June 2007, I (Kevin Jardine, the creator of this site), downloaded the complete A-band (8.28 μm) MSX dataset and used it to produce a single large colour map of the galactic plane. Like many astronomical images, the MSX A-band measures the intensity of a single frequency of radiation. Compressing this data into 256 shades of gray would lose most of the detail in the data, so I created a 24-bit false colour scheme designed to show off as much of the detail in the data as possible.
The complete MSX dataset forms a 216000 x 5998 pixel image. As this image is obviously too large to view at once, I created a Flash application to view the data at two levels of resolution - the full resolution and one reduced to a tenth of the size in height and width (that is, a 21600x600 pixel image). The Flash application makes it possible to pan and zoom over the MSX images.
I have superimposed the 3229 major star formation regions of the Avedisova catalog on top of the MSX images. Each star formation region is represented by a yellow dot, and hovering over the dot gives the name (if any) in the Avedisova catalog and its bibliographic reference number.
At the full MSX zoom level, I have added another 11933 objects from the Avedisova catalog that are subcomponents of the major star formation regions. These are represented by red dots.
As many of the Avedisova objects do not have names or have names that are merely descriptive (such as "CO Cloud"), I have added the ability to generate a list of nearby SIMBAD objects by clicking anywhere on the map. (See "Using the Galactic Plane Explorer" below for more detail on this.) In a future version of the Explorer, I hope to be able to link directly to the Avedisova bibliographic reference for each object.
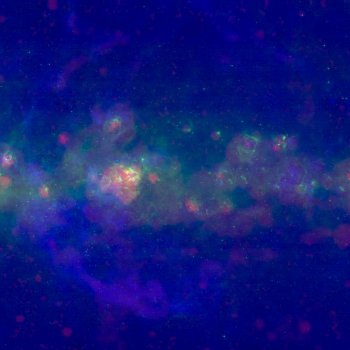
A composite wavelength image of the great star formation region RCW 74 and nearby nebulae in the direction of the Cen OB1 association.
Other data sets
With a working infrared Explorer, I decided to seek out other maps of the galactic plane outside the visual spectrum, and eventually added radio and microwave maps, as well as data from Douglas Finkbeiner's all-sky hydrogen-alpha map as a visual frequency comparison. None of this data is as detailed as the MSX data, but it is still useful when resized to the lower resolution 21600x600 pixel image.
I also added two additional overlays beyond the Avedisova catalog - a list of known nebula and supernova remnants, and a list of known ionising stars (Wolf-Rayet, O-stars and B-stars hotter than B3) as well as the extent of star clusters and associations containing these OB stars. Hovering your mouse over each star gives its name, spectral class and luminosity.
Finally, out of curiosity, I created a 21600x600 composite image of the galactic plane with radio in red, infrared in green and hydrogen-alpha in blue. This image has turned out to be more useful than I had originally imagined as many objects radiate at all three frequencies and a composite image gives a better idea of their structure.
Using the Galactic Plane Explorer
Unlike the face-on map of the Milky Way also available from this site, the Galactic Plane Explorer shows the sky as we would see it from Earth, albeit with eyes that could detect infrared, radio and microwave frequencies. Unlike most popular star maps, the Explorer uses galactic coordinates. It always starts at galactic longitude 0° (the galactic nucleus) and shows the parts of the galaxy that stretch from -5° latitude to +5° latitude. As most of the Milky Way is a very flat disk, most of the bright stars and nebulae found in the galaxy can be found within this latitude range.
I recommend that you put your browser in full screen mode to make it easy to access all the parts of the Explorer interface.
As the Explorer downloads data and generates images for many thousands of objects, it might take a minute to load. Please be patient.
You might get a message that says something like:
A script in this movie is causing Macromedia Flash Player 9 to run slowly.
If it continues to run, your computer may become unresponsive.
Do you want to abort the script?
If you do, say "no" - the application will eventually run and should run quickly once the initial data is downloaded and processed.
By default, clicking on the map re-centres it on the point clicked. This is the standard method Google Maps uses to pan maps and I implemented it because it would be familiar to most people. You can move right, left, up or down by clicking in that direction on the map image.
The bottom section contains a drop down box to select one of the five available image sets: infrared, radio, microwave, hydrogen-alpha or composite. There are also radio buttons to choose between the three available overlays: nebulae/SNRs, OB stars/clusters/associations, or Avedisova star-formation regions.
If you are viewing the infrared images, you can use the zoom toggle to switch between the low and high resolution MSX data. The toggle is not available for any of the other image data. Zooming in always zooms in on the map region at the centre of the image.
You can use the SIMBAD toggle at any time to change the Explorer's response to mouse clicks. When the SIMBAD toggle is on, clicking on the map brings up a list of SIMBAD objects near that point in a second window. When the SIMBAD toggle is off, clicking on the map re-centres the map to that point.
The horizontal navigation strip below the main map area allows for rapid navigation. Simply click on the appropriate location to move to that part of the galactic plane.
The face-on galaxy image at the bottom right shows you what part of the Milky Way you are currently viewing.
Downloading complete map images
In addition to viewing them in the Explorer, you can download any of the 21600x600 galactic plane images below for off-line viewing. On Windows, you would do this by right-clicking on the image and selecting "Save link as ...". You can also view the images directly in your browser by clicking on the image (although viewing images this large may crash some browsers.)
Infrared

Radio

Microwave

Hydrogen-alpha

Composite of radio, infrared and hydrogen-alpha

Sources
Images
The MSX infrared data is described here and the complete set of FITS data can be downloaded here.
The radio data is from two separate sources. I started with the Effelsberg 11 cm (2.7 GHz) data from here and supplemented it with the lower resolution Parkes 2.4 GHz data from here. Because the Parkes data is lower resolution and has a somewhat different frequency, there are obvious transition points in the radio map. There does not appear to be a complete galactic plane radio map at the Effelsberg resolution or better, so this somewhat awkward compromise will have to do for now.
The microwave data is from the FITS file available from the Milky Way in Molecular Clouds page here.
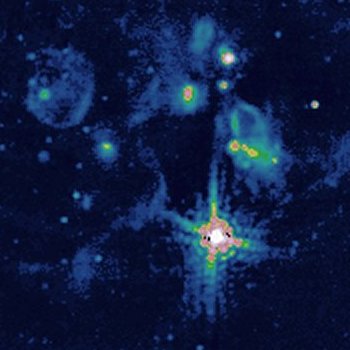
The Cassiopeia A supernova remnant and nearby nebulae in the direction of the Cas OB2 association, at radio frequency.
The hydrogen-alpha data is from the highest resolution data available from Douglas Finkbeiner's all-sky hydrogen-alpha page here.
In all cases the maps were constructed from the data using 24-bit colour schemes of my own devising in which the hue shifts from a dark blue to a light red with the radiation intensity.
The composite map was created by combining the radio (red), infrared (green) and hydrogen-alpha (blue) radiation intensity data.
Overlays
The nebula data were mostly taken from the standard Sharpless, RCW and Gum catalogs described elsewhere on this website. I supplemented this with SIMBAD research where there were prominent infrared or radio nebulae not in these catalogs.
The supernova remnants were taken from the catalog on Dave Green's website.
The ionising star data were taken from Cameron Reed's Catalog of Galactic OB Stars (the version dated 24 July 2007). This is much more current than the 1984 Blaha and Humphreys data used to construct the face-on map of the galaxy elsewhere on this website. The Reed data lacks distance estimates but these were not necessary for the Galactic Plane Explorer. The Reed data is quite hard to find and can only be downloaded one file at a time. The five files are obcatalog.dat, obubvbeta.dat, ob4color.dat, obmk.dat and obnotes.doc.
The ionising star cluster data were taken from Nina Kharchenko's star cluster catalog and the related new cluster catalog. I selected the 143 clusters which had at least one ionising star (Wolf-Rayet, O-star or B star hotter than B3) as a probable member.
The OB association boundaries are taken from the Blaha-Humphreys luminous star catalog.
Veta Avedisova's Catalog of Star-Forming Regions in the Galaxy can be downloaded from Vizier here.
Thank you!
Thanks for reading this introduction. You can find the actual Galactic Plane Explorer application here. If you enjoy using it or have questions or suggestions for improvements, you can leave a comment on my blog here.